11 minutes
Monitoring Corda Nodes with Prometheus, Loki and Grafana Dashboard on Docker

Cover image by Kyle Hanson.
- Motivation
- Deployment Stack
- Github
- Step by step instructions
- Step 1: Prepare the workspace directory
- Step 2: Create node configuration files
- Step 3: Run the Corda Network Bootstrapper
- Step 4: Prepare for Docker
- Step 5: Create the Prometheus configuration files
- Step 6: Create the Docker-Compose file
- Step 7: Set up Grafana
- Step 8: Explore Grafana Loki
- Step 9: Run some Corda Finance flows
- Further reading
Motivation
In a previous blog post, I wrote about monitoring Corda nodes with Prometheus, Grafana and ELK (Elasticsearch, Logstash and Kibana) on Docker. In this post, I will show you a how to monitor your Corda nodes with Grafana Dashboard as the only user interface for metrics and log files.
The ELK stack is removed in favour of Promtail and Grafana Loki for this deployment demonstration.
The architecture deployed provides a clean method of managing your nodes’ operational needs for both JMX metrics as well as visualising log files. Of course, the “archaic” way would be to tail and grep log files to find what you need. This method becomes troublesome when, for example, you are trying to debug a Corda transaction between multiple nodes.
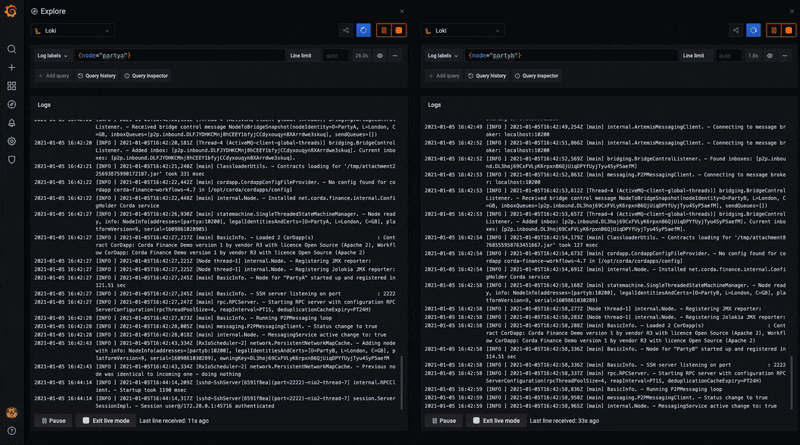
The end result is the ability to use Grafana Dashboard explorer to provide a split screen view of log files for nodes:
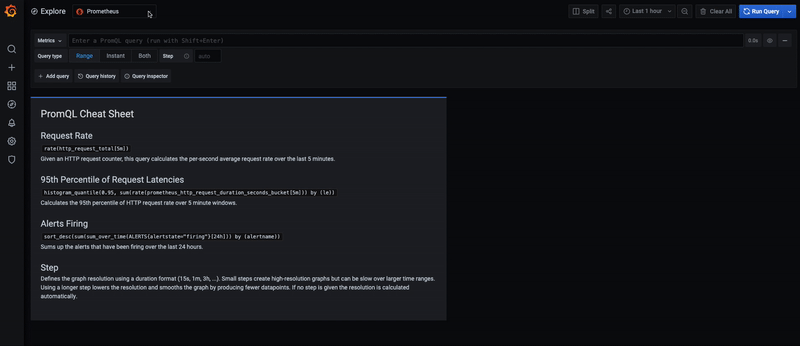
And of course, JMX metrics dashboard is included:

Deployment Stack
A few amendments to the stack are required from my previous post, take a look at the diagram below:
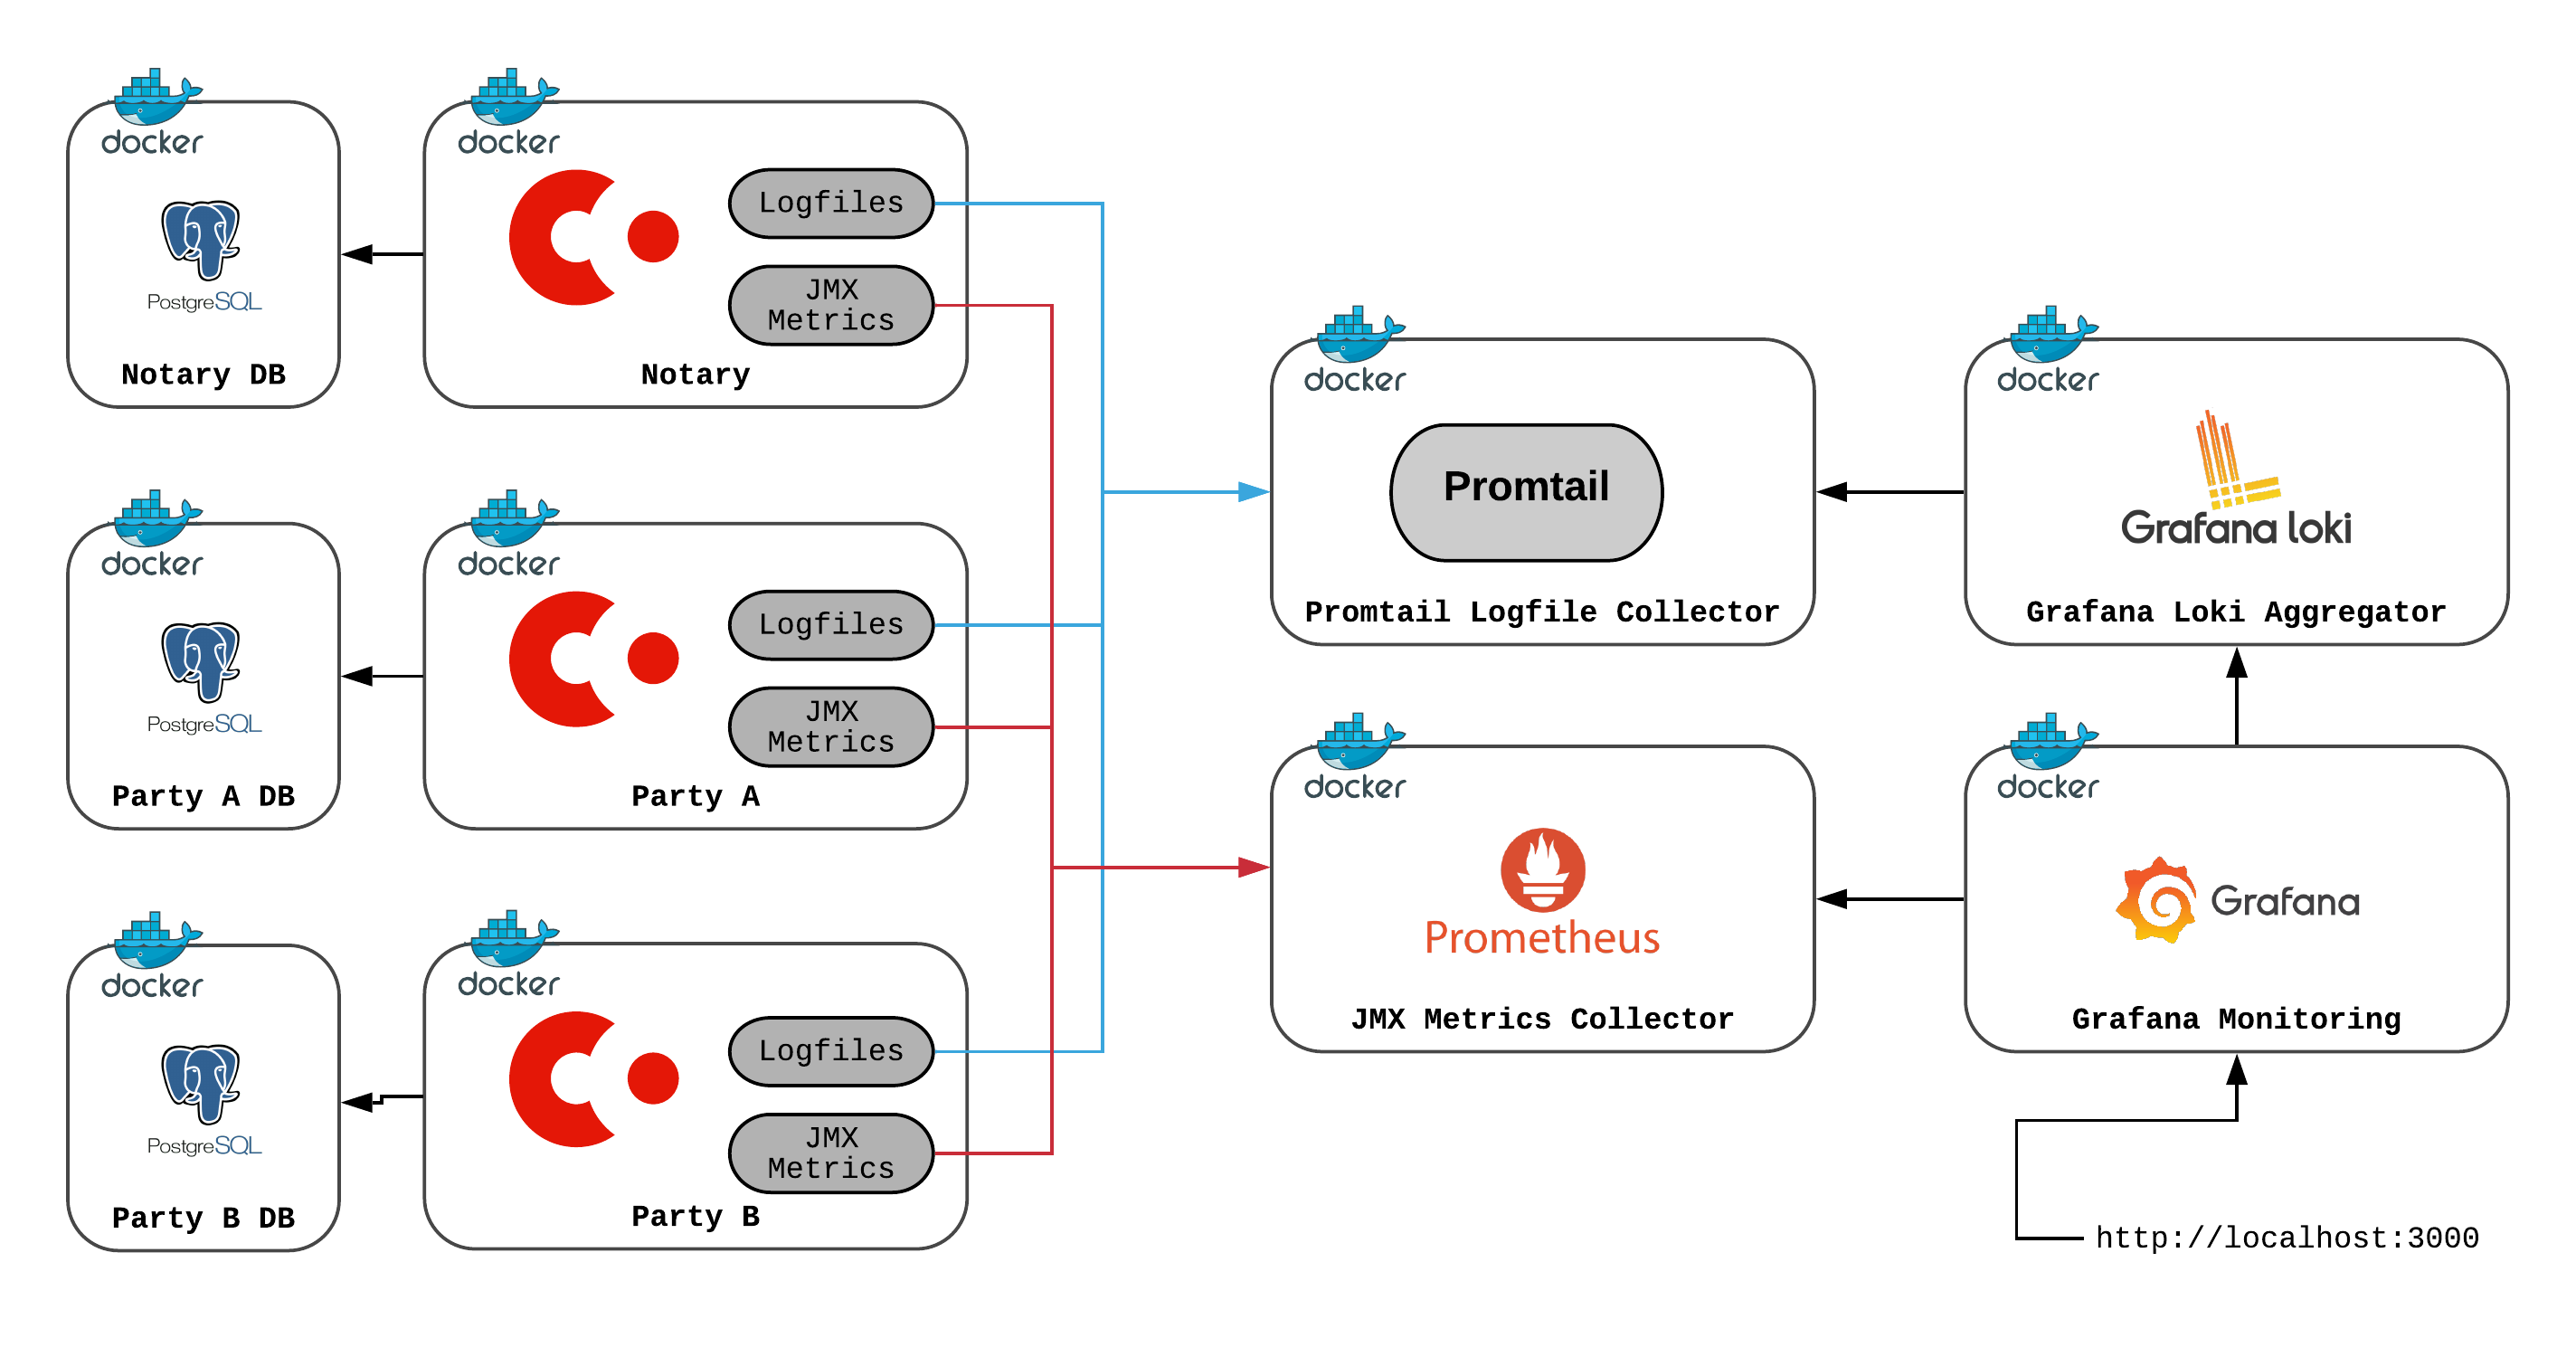
Corda - Corda Open-Source 4.7 will be used in this deployment (latest version at the time of writing this post).
PostgreSQL databases for each node - I have added this to show how easy it is to switch away from H2.
Promtail logfile collector - extracts the log files from locations specified in its configuration.
Grafana Loki - aggregates and parses logfiles.
Prometheus - an opensource monitoring solution which will be used to parse JMX metrics.
Grafana Monitoring Dashboard - provides a configuration user interface, collating multiple datasources.
Github
Check out the Github Repository where you will find step-by-step instructions in the README and some handy shell scripts.
Clone the repo:
➜ git clone https://github.com/neal-shah/corda-monitoring-prometheus-grafana-loki
Step by step instructions
Step 1: Prepare the workspace directory
Create the directory structure and download the necessary in this step. 3 jars are required:
- corda-tools-network-bootstrapper-4.7.jar
- corda-finance-contracts-4.7.jar
- corda-finance-workflows-4.7.jar
The two corda-finance-*.jar's make up the Corda Finance CorDapp which will be used to test transactions across peer nodes.
Execute the 01_setup-directory.sh shell script:
➜ ./01_setup-directory.sh
You should see a new directory called mynetwork created, with a few sub directories and the required jars.
➜  tree mynetwork
mynetwork
├── corda-tools-network-bootstrapper-4.7.jar
├── grafana
├── loki
├── prometheus
├── promtail
└── shared
    ├── additional-node-infos
    ├── cordapps
        ├── corda-finance-contracts-4.7.jar
        └── corda-finance-workflows-4.7.jar
    └── drivers
        └── jmx_prometheus_javaagent-0.13.0.jar
Step 2: Create node configuration files
You will require 3 node configurations:
- Notary
- PartyA
- PartyB
Execute the 02_create-node-configurations.sh shell script:
➜ ./02_create-node-configurations.sh
Our mynetwork directory now looks like the following:
➜  tree mynetwork
mynetwork
├── corda-tools-network-bootstrapper-4.7.jar
├── grafana
├── loki
├── notary_node.conf
├── partya_node.conf
├── partyb_node.conf
├── prometheus
├── promtail
└── shared
    ├── additional-node-infos
    ├── cordapps
        ├── corda-finance-contracts-4.7.jar
        └── corda-finance-workflows-4.7.jar
    └── drivers
        └── jmx_prometheus_javaagent-0.13.0.jar
This will create three .conf files, each representing a single node.
Here’s an example of the partya_node.conf file:
devMode=true
emailAddress="test@test.com"
myLegalName="O=PartyA, L=London, C=GB"
p2pAddress="partya:10200"
rpcSettings {
    address="0.0.0.0:10201"
    adminAddress="0.0.0.0:10202"
}
security {
    authService {
        dataSource {
            type=INMEMORY
            users=[
                {
                    password="password"
                    permissions=[
                        ALL
                    ]
                    username=user
                }
            ]
        }
    }
}
cordappSignerKeyFingerprintBlacklist = []
sshd {
  port = 2222
}
dataSourceProperties = {
    dataSourceClassName = "org.postgresql.ds.PGSimpleDataSource"
    dataSource.url = "jdbc:postgresql://partyadb:5432/postgres"
    dataSource.user = postgres
    dataSource.password = "test"
}
Step 3: Run the Corda Network Bootstrapper
The Corda Network Bootstrapper creates a development network of peer nodes, using dev certificates. You don’t need to worry about registering nodes - the bootstrapper takes care of that for you.
Execute the 03_run-corda-network-bootstrapper.sh shell script:
➜ ./03_run-corda-network-bootstrapper.sh

Bootstrapping local test network in /path/to/corda-monitoring-prometheus-grafana-loki/mynetwork
Generating node directory for partya
Generating node directory for notary
Generating node directory for partyb
Nodes found in the following sub-directories: [notary, partya, partyb]
Found the following CorDapps: []
Waiting for all nodes to generate their node-info files...
Distributing all node-info files to all nodes
Loading existing network parameters... none found
Gathering notary identities
Generating contract implementations whitelist
New NetworkParameters {
      minimumPlatformVersion=9
      notaries=[NotaryInfo(identity=O=Notary, L=London, C=GB, validating=false)]
      maxMessageSize=10485760
      maxTransactionSize=524288000
      whitelistedContractImplementations {

      }
      eventHorizon=PT720H
      packageOwnership {

      }
      modifiedTime=2021-01-05T15:31:25.050Z
      epoch=1
  }
Bootstrapping complete!
Step 4: Prepare for Docker
There are some common files that are shared between the peer nodes. You can put these in one folder - this will make our Docker-Compose service volumes a bit clearer to read.
Execute the 04_copy-common-files.sh shell script:
➜ ./04_copy-common-files.sh
This will copy across common files to the ./mynetwork/shared folder.
Step 5: Create the Prometheus configuration files
Execute the 05_create-monitoring-configurations.sh shell script:
➜ ./05_create-monitoring-configurations.sh
This creates a config file in ./mynetwork/prometheus/prometheus.yml:
global:
  scrape_interval: 5s
  external_labels:
    monitor: "corda-network"
scrape_configs:
  - job_name: "notary"
    static_configs:
      - targets: ["notary:8080"]
    relabel_configs:
      - source_labels: [__address__]
        regex: "([^:]+):\\d+"
        target_label: node
  - job_name: "nodes"
    static_configs:
      - targets: ["partya:8080", "partyb:8080"]
    relabel_configs:
      - source_labels: [__address__]
        regex: "([^:]+):\\d+"
        target_label: node
Check out the ./mynetwork/promtail/ and ./mynetwork/loki/ directories for their respective configuration files.
You define the JMX exporter targets (endpoints) for each node. They are all using port 8080 - don’t worry about port conflicts, Docker will take care of the networking.
Step 6: Create the Docker-Compose file
Finally, you need a docker-compose.yml file which allows us to bring up all the services in just one command.
Execute the 06_create-docker-compose-file.sh shell script:
➜ ./06_create-docker-compose.sh
You can find the docker-compose.yml file in ./mynetwork/docker-compose.yml. Inside the file, you have created services for each node database, along with Prometheus, Grafana, Promtail and Loki:
...
  prometheus:
    image: prom/prometheus:latest
    container_name: prometheus
    ports:
      - 9090:9090
    command:
      - --config.file=/etc/prometheus/prometheus.yml
    volumes:
      - ./prometheus/prometheus.yml:/etc/prometheus/prometheus.yml:ro

  grafana:
    hostname: grafana
    container_name: grafana
    image: grafana/grafana:latest
    ports:
      - 3000:3000
    volumes:
      - grafana-storage:/var/lib/grafana
    environment:
      - "GF_INSTALL_PLUGINS=grafana-clock-panel"

  loki:
    image: grafana/loki:2.0.0
    container_name: loki
    hostname: loki
    ports:
      - "3100:3100"
    volumes:
     - ./loki/loki-config.yaml:/etc/loki/local-config.yaml
    command: -config.file=/etc/loki/local-config.yaml

  promtail:
    container_name: promtail
    hostname: promtail
    image: grafana/promtail:2.0.0
    volumes:
      - ./partya/logs:/var/log/partya:ro
      - ./partyb/logs:/var/log/partyb:ro
      - ./notary/logs:/var/log/notary:ro
      - ./promtail/promtail-config.yaml:/etc/promtail/config.yml
    command: -config.file=/etc/promtail/config.yml
Start up the services using the following command:
➜ docker-compose -f ./mynetwork/docker-compose.yml up -d

Creating network "mynetwork_default" with the default driver
Creating notarydb   ... done
Creating promtail   ... done
Creating partyadb   ... done
Creating loki       ... done
Creating grafana    ... done
Creating partybdb   ... done
Creating prometheus ... done
Creating notary     ... done
Creating partya     ... done
Creating partyb     ... done
View running containers:
➜ docker ps -a
CONTAINER ID        IMAGE                                  COMMAND                  CREATED             STATUS              PORTS                                                                    NAMES
601243370b4a        corda/corda-zulu-java1.8-4.7:RELEASE   "bash -c 'java -jar …"   42 seconds ago      Up 39 seconds       10200/tcp, 10202/tcp, 0.0.0.0:3333->2222/tcp, 0.0.0.0:10008->10201/tcp   partyb
ad7961082927        corda/corda-zulu-java1.8-4.7:RELEASE   "bash -c 'java -jar …"   42 seconds ago      Up 40 seconds       10200/tcp, 0.0.0.0:2222->2222/tcp, 10202/tcp, 0.0.0.0:10005->10201/tcp   partya
cb584b5b1438        corda/corda-zulu-java1.8-4.7:RELEASE   "bash -c 'java -jar …"   43 seconds ago      Up 41 seconds       10200/tcp, 10202/tcp, 0.0.0.0:10002->10201/tcp                           notary
0459468955da        grafana/promtail:2.0.0                 "/usr/bin/promtail -…"   44 seconds ago      Up 42 seconds                                                                                promtail
839e04ec169c        prom/prometheus:latest                 "/bin/prometheus --c…"   44 seconds ago      Up 42 seconds       0.0.0.0:9090->9090/tcp                                                   prometheus
c41ee92ce556        grafana/loki:2.0.0                     "/usr/bin/loki -conf…"   44 seconds ago      Up 43 seconds       0.0.0.0:3100->3100/tcp                                                   loki
bfeaa67f8550        postgres:latest                        "docker-entrypoint.s…"   44 seconds ago      Up 42 seconds       5432/tcp                                                                 partybdb
d5c98a27f851        postgres:latest                        "docker-entrypoint.s…"   44 seconds ago      Up 42 seconds       5432/tcp                                                                 partyadb
107a4a006492        grafana/grafana:latest                 "/run.sh"                44 seconds ago      Up 42 seconds       0.0.0.0:3000->3000/tcp                                                   grafana
51494d3ac333        postgres:latest                        "docker-entrypoint.s…"   44 seconds ago      Up 43 seconds       5432/tcp                                                                 notarydb
Step 7: Set up Grafana
On your browser, go to http://localhost:3000.
Grafana will ask you for a login - the default admin login is:
- Username: admin
- Password: admin
Change your password as instructed, and then you should see the Grafana homepage.
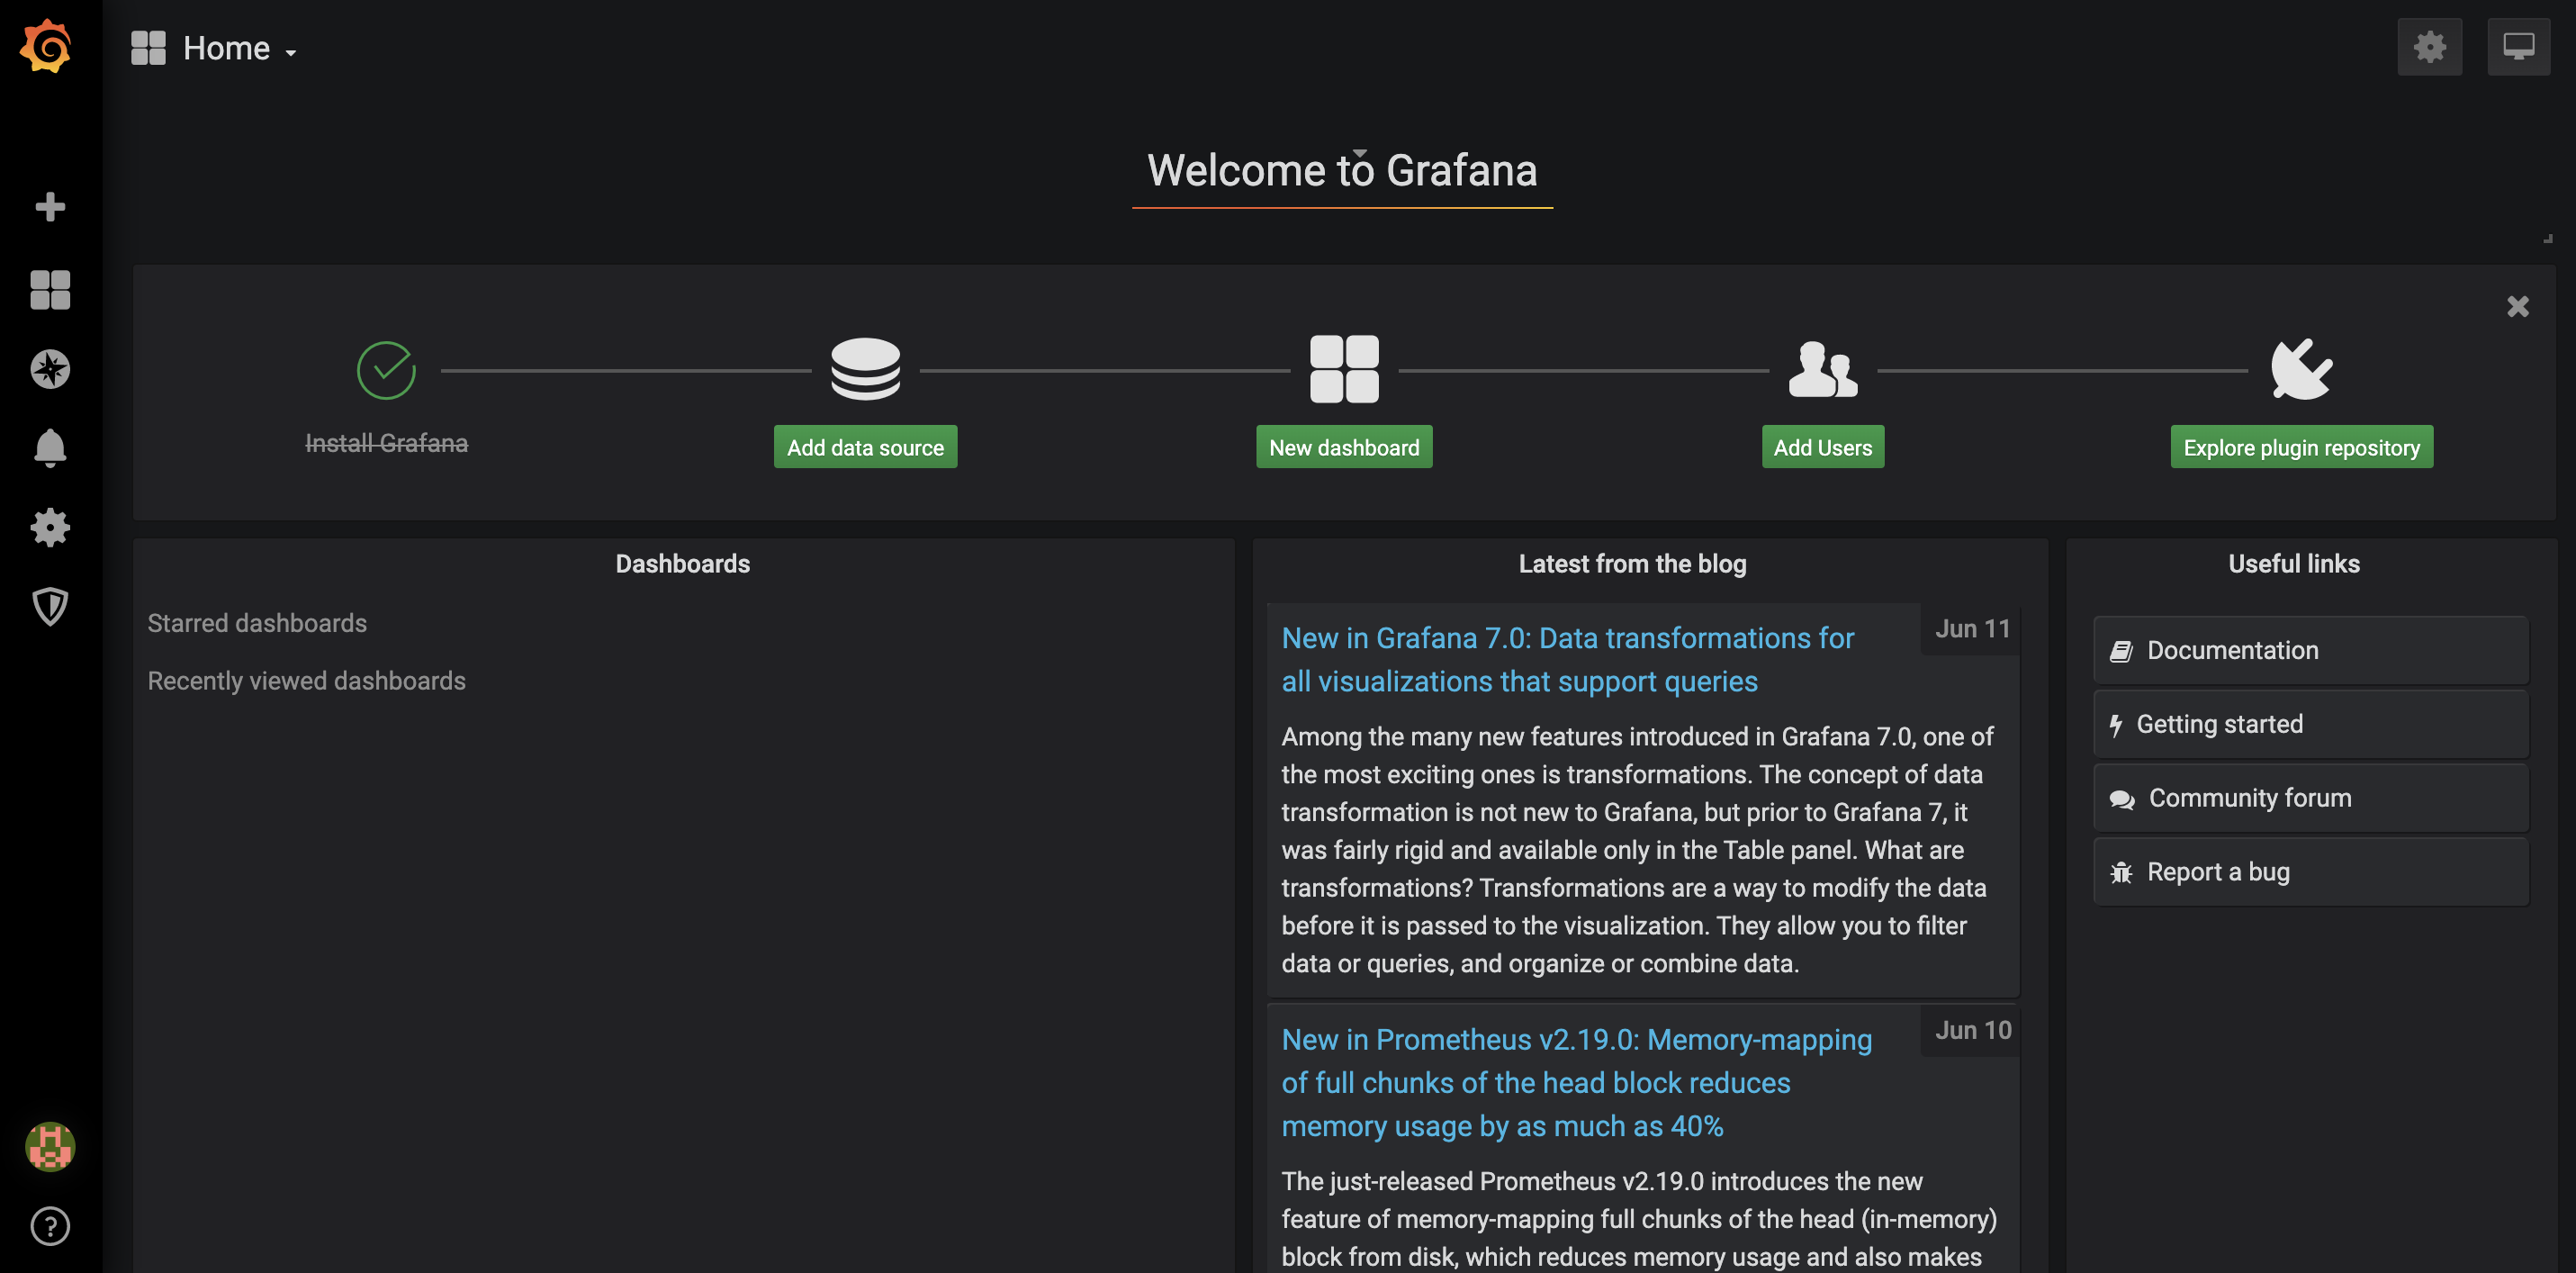
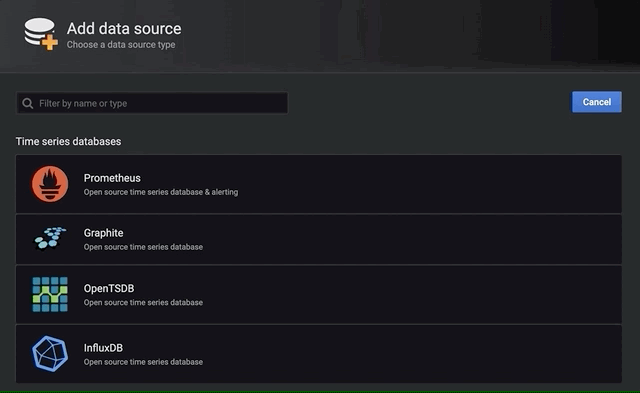
Click on Add data source.
Step 7.1: Add JMX Metrics Dashboard
Select the Prometheus data source under Time series databases.
Under HTTP, set the URL to http://prometheus:9090. You can use the Prometheus Docker container hostname here as all of the containers run on the same Docker bridge network, so no explicit container IP addresses need to be used for connectivity.
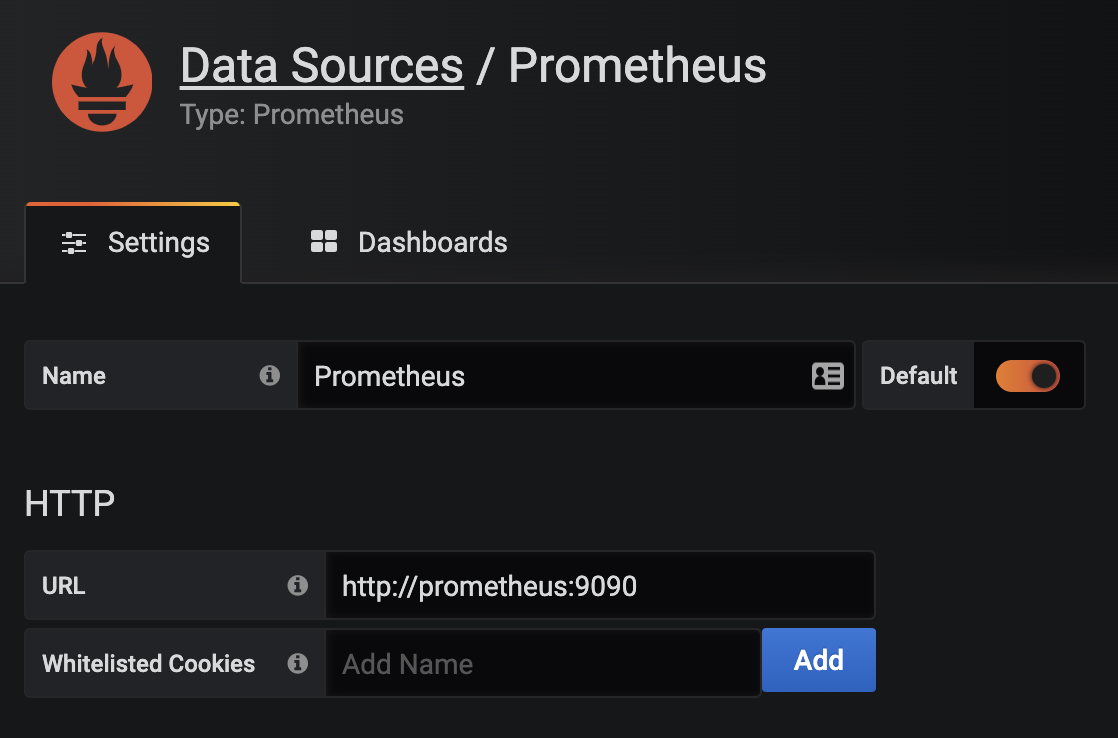
At the bottom of the page, click on Save & Test. You should see a green alert - Data source is working.
Hover over the Dashboards icon, and click Manage.
Click Import, then Upload .json file, and navigate to the clone repository folder. Inside the grafana folder, you will see a json file - Grafana-Corda-Dashboard.json, see here.
On the following screen, click Import.
Boom, a dashboard appears!
Step 7.2: Add Loki Data Source
Add the Loki data source under Logging & document databases.

Under HTTP, set the URL to http://loki:9090.
At the bottom of the page, click on Save & Test. You should see a green alert - Data source is working.
Step 8: Explore Grafana Loki
In the Grafana side pane, click on Explore.
At the top you will see a dropdown with data sources you can select - select the Loki data source.
Click Split on the top right menu pane.
On the left-hand side Loki explorer, click on the Log labels dropdown, select node, then select partya. Similarly on the right-hand side Loki explorer, select partyb.
On both explorers top right menu, click the Live stream your logs button.
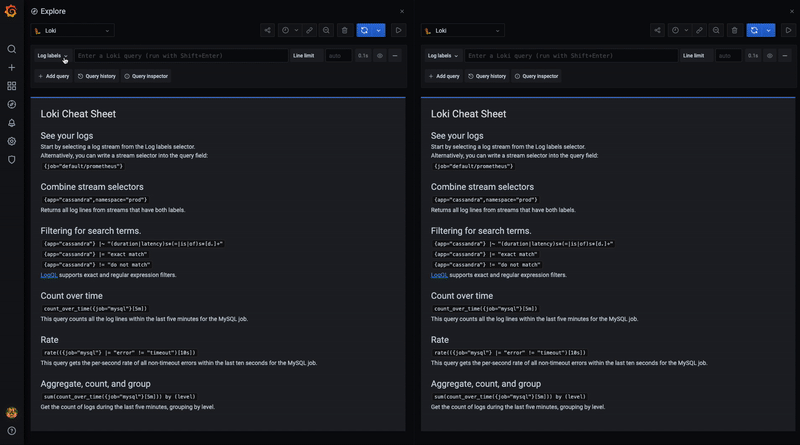
You now have both partya and partyb logs live streaming in one UI!
Step 9: Run some Corda Finance flows
On a terminal window, SSH into the PartyA node Crash shell:
➜ ssh user@localhost -p 2222
When prompted, the password is password.
You should see the following in your terminal:
Welcome to the Corda interactive shell.
You can see the available commands by typing 'help'.

Mon Jun 15 07:52:13 GMT 2020>>>
Let’s execute a CashIssueAndPaymentFlow:
Mon Jun 15 07:53:52 GMT 2020>>> flow start CashIssueAndPaymentFlow amount: 1000 GBP, issueRef: TestTransaction, recipient: PartyB, anonymous: false, notary: Notary

 ✓ Starting
 ✓ Issuing cash
          Generating anonymous identities
     ✓ Generating transaction
     ✓ Signing transaction
     ✓ Finalising transaction
              Requesting signature by notary service
                  Requesting signature by Notary service
                  Validating response from Notary service
         ✓ Broadcasting transaction to participants
 ✓ Paying recipient
     ✓ Generating anonymous identities
     ✓ Generating transaction
     ✓ Signing transaction
     ✓ Finalising transaction
         ✓ Requesting signature by notary service
             ✓ Requesting signature by Notary service
             ✓ Validating response from Notary service
         ✓ Broadcasting transaction to participants
▶︎ Done
Flow completed with result: Result(stx=SignedTransaction(id=FB08662B2E0A19ECF9B0E3E44D2DF25934F9576DBF262D794EE2C795C3269503), recipient=O=PartyB, L=London, C=GB)
In your Loki explorer split screen, you will see that both partya and partyb will now show you the latests logs of the transaction taking place.
You can use Loki as a data source in your dashboards, adding variables as appropriate and provide search functionality for your users too. Advanced configuration can be handled where multiple data sources can be related by labels or annotations - this provides a wholesome approach to fault finding and issue diagnosis.
Further reading
JMX Monitoring and Prometheus
Corda nodes expose JMX metrics that can be collected to provide data analysis and monitoring functionality.
This is enabled using 2 components:
- On the node side, the Prometheus JMX Exporter is run as a JVM plugin and provides an API interface for the JMX metrics.
- The Prometheus Server collects these metrics using a pre-defined scrape interval, providing both a UI and an API for processed data to be consumed.
To run Corda with the Prometheus JMX Exporter, add the driver to the drivers folder in the node directory, and run the corda.jar with the -javagent option. For example:
➜ java -Dcapsule.jvm.args=-javaagent:/path/to/jmx_prometheus_javaagent-0.13.0.jar=8080:/path/to/config.yml -jar corda.jar
The Prometheus JMX Exporter config.yml as specified above can contain config options as specified here - you can simply make this file contain {} to use default options.
The Prometheus Server also requires a configuration file, prometheus.yml, containing a number of config options such as setting target exporters, alerting and rules.
Here is a simple example of a prometheus.yml file targeting a single Corda node which is exporting JMX metrics:
global:
  scrape_interval: 10s        # How frequently to scrape targets
  external_labels:            # Label that can be used by external systems for filtering
    monitor: "corda-network"
scrape_configs:               # A list of scrape configurations
  - job_name: "nodes"         # The job name assigned to scraped metrics
    static_configs:           # Static list of targets to scrape metrics from
      - targets: ["partya:8080", "partyb:8080"]
    relabel_configs:          # List of target relabel configurations
      - source_labels: [__address__]
        regex: "([^:]+):\\d+"
        target_label: node
Under the global block, you can set global attributes to all the scrape_configs. Here, you set the scrape_interval to get metrics every 10 seconds. scrape_configs tells Prometheus what services to target and scrape metrics from.
relabel_configs block in the config above allows you to rewrite the target labels - for example, partya:8080 as the instance label will become partya. This just makes things a bit neater when displaying information on a dashboard.
Grafana
Grafana provides a slick UI interface for consuming and aggregating realtime data from our exposed JMX metrics. You can indeed use Graphite rather than Prometheus - there are a number of Graphite vs. Prometheus articles online to determine your choice.
monitoringprometheusdockergrafanacordalokipromtail
2141 Words
2021-01-05 09:17 +0000
d089141 @ 2021-01-07