12 minutes
Monitoring Corda Nodes with Prometheus, Grafana and ELK on Docker
Cover image by Ian Simmonds.
- Motivation
- A useful diagram and dashboards
- Github
- Step by step instructions
- Step 1: Prepare the workspace directory
- Step 2: Create node configuration files
- Step 3: Run the Corda Network Bootstrapper
- Step 4: Prepare for Docker
- Step 5: Create the Prometheus configuration files
- Step 6: Create the Docker-Compose file
- Step 7: Set up Kibana
- Step 8: Set up Grafana
- Step 9: Run some Corda Finance flows
- Step 10: Explore Grafana and ELK
- Further reading
- Conclusion
Motivation
When deploying Corda nodes in different environments, it’s good practice to deploy monitoring and extract performance metrics to determine how well your node or network is doing.
This could be for a number of reasons, to name a few:
- Ensuring and alerting node status
- Analysing CorDapp flow performance
- Monitoring JVM and machine resource usage
Following on from Ashutosh Meher’s fantastic article and video on Containerizing Corda with Corda Docker Image and Docker Compose, this blog post will expand a bootstrapped local network by adding node monitoring, using Prometheus, Grafana and the ELK (Elasticsearch, Logstash and Kibana) stack. All running on Docker.
The following Docker images will be used:
A useful diagram and dashboards
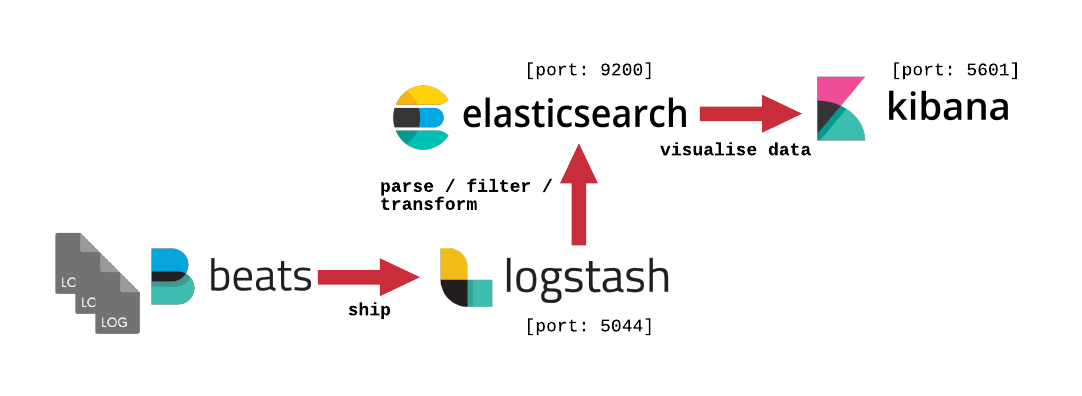
Here is a diagram showing our local deployment architecture.

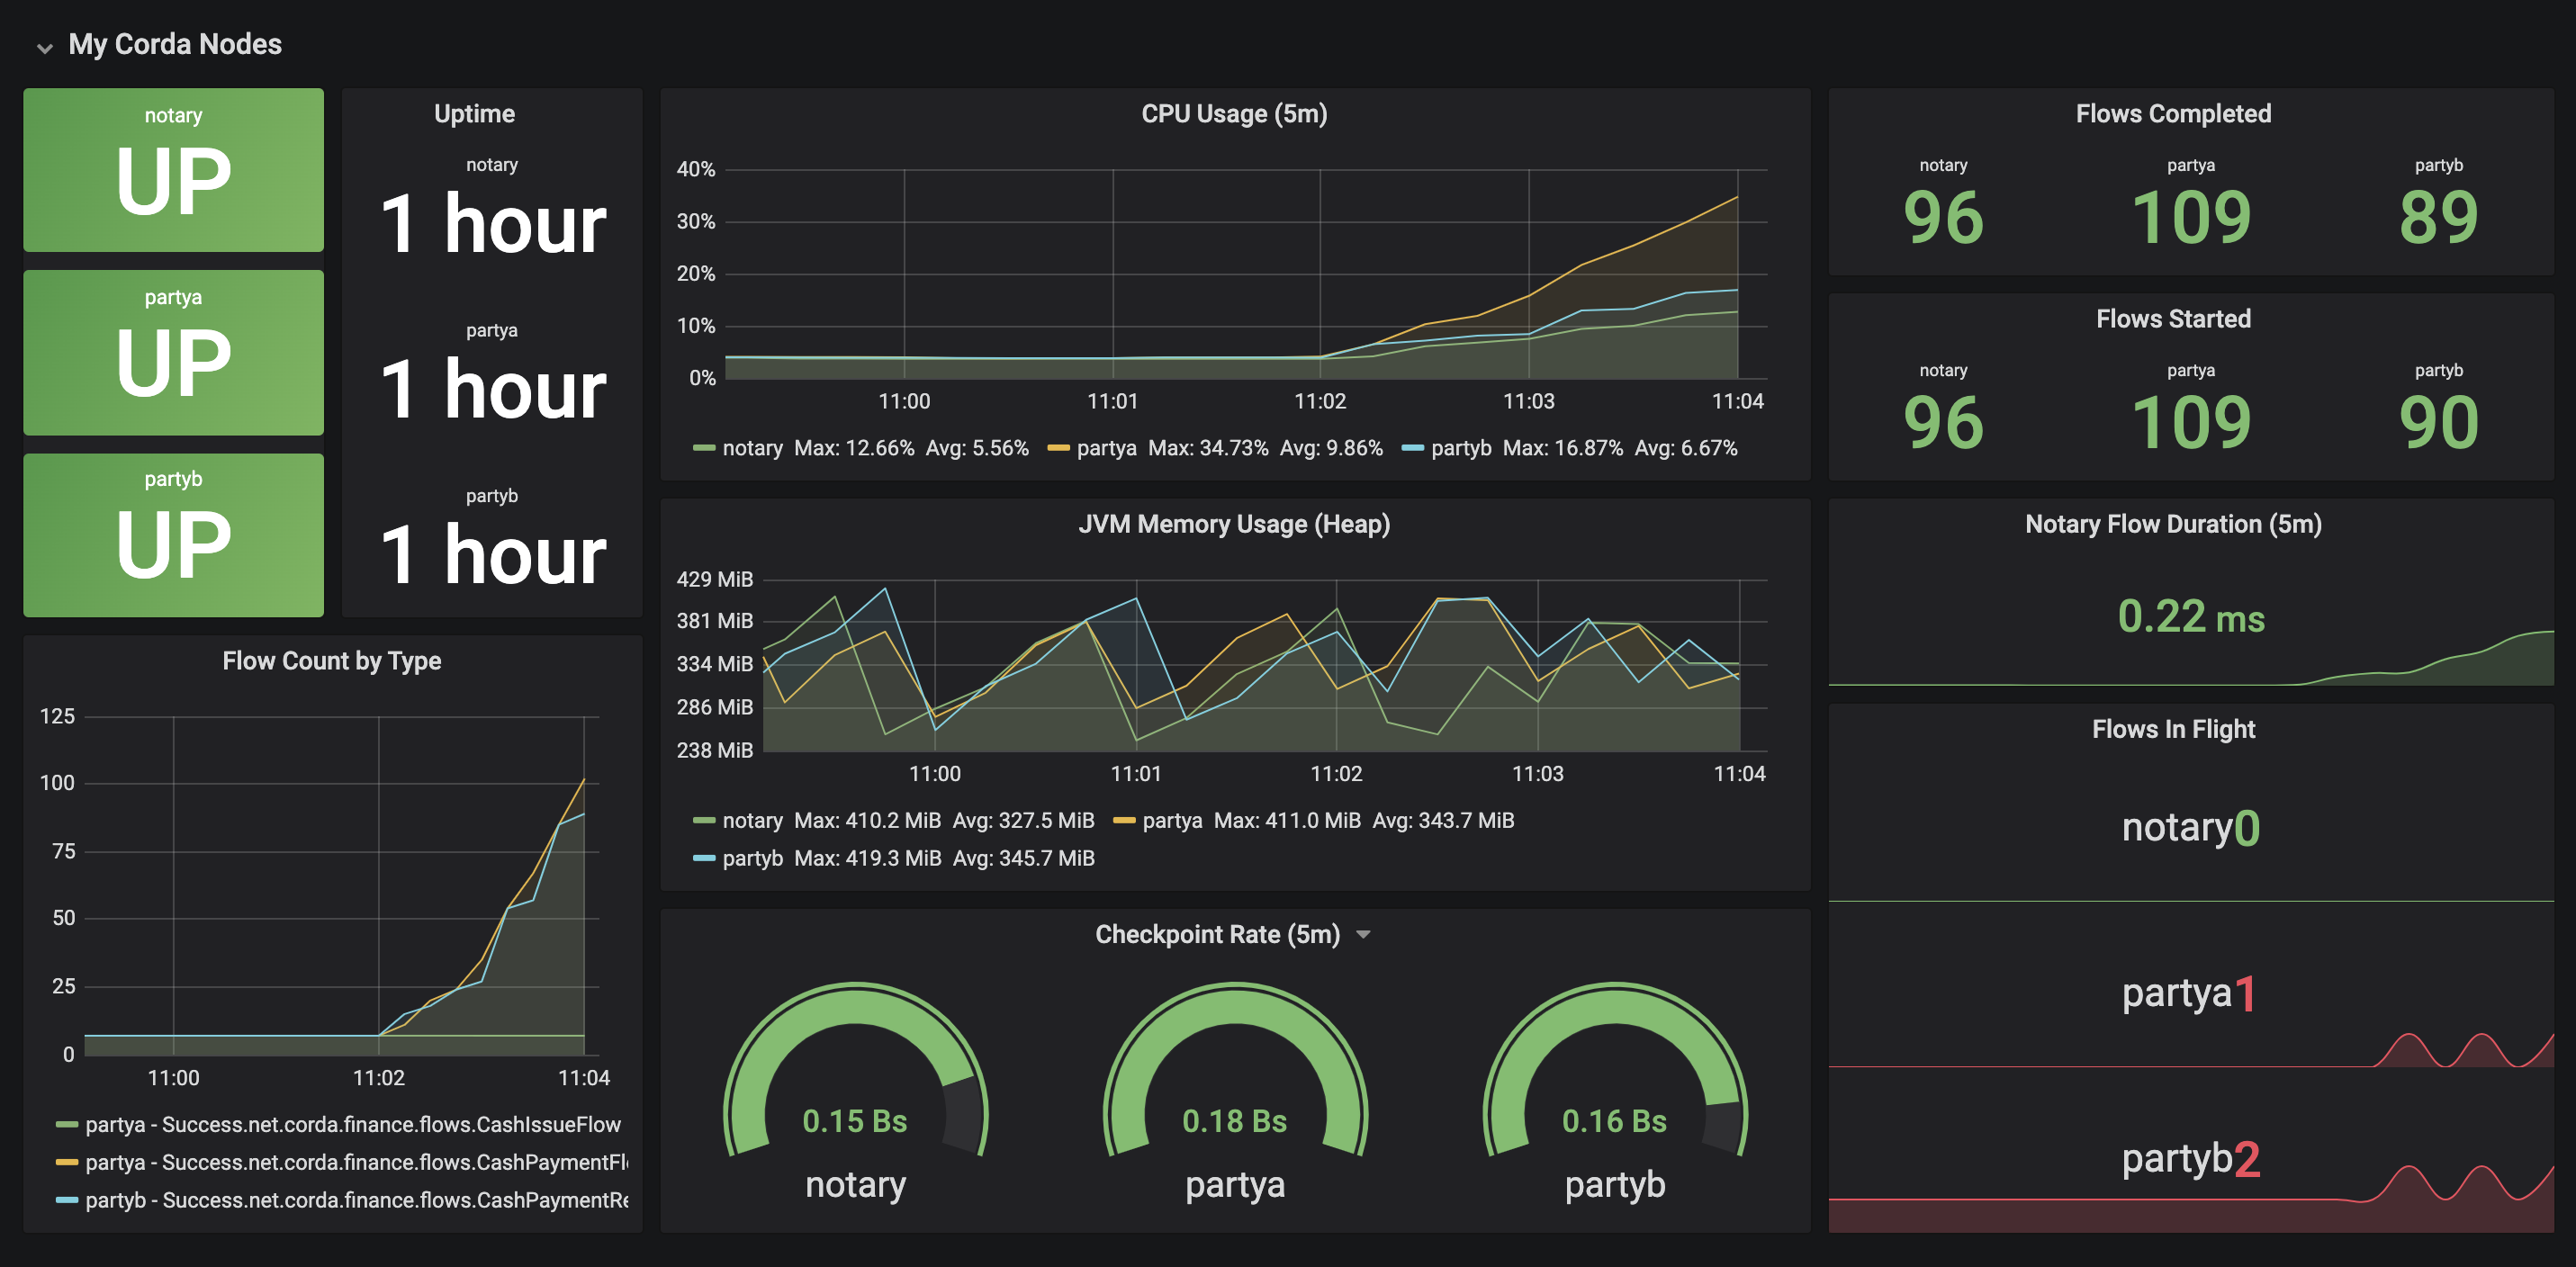
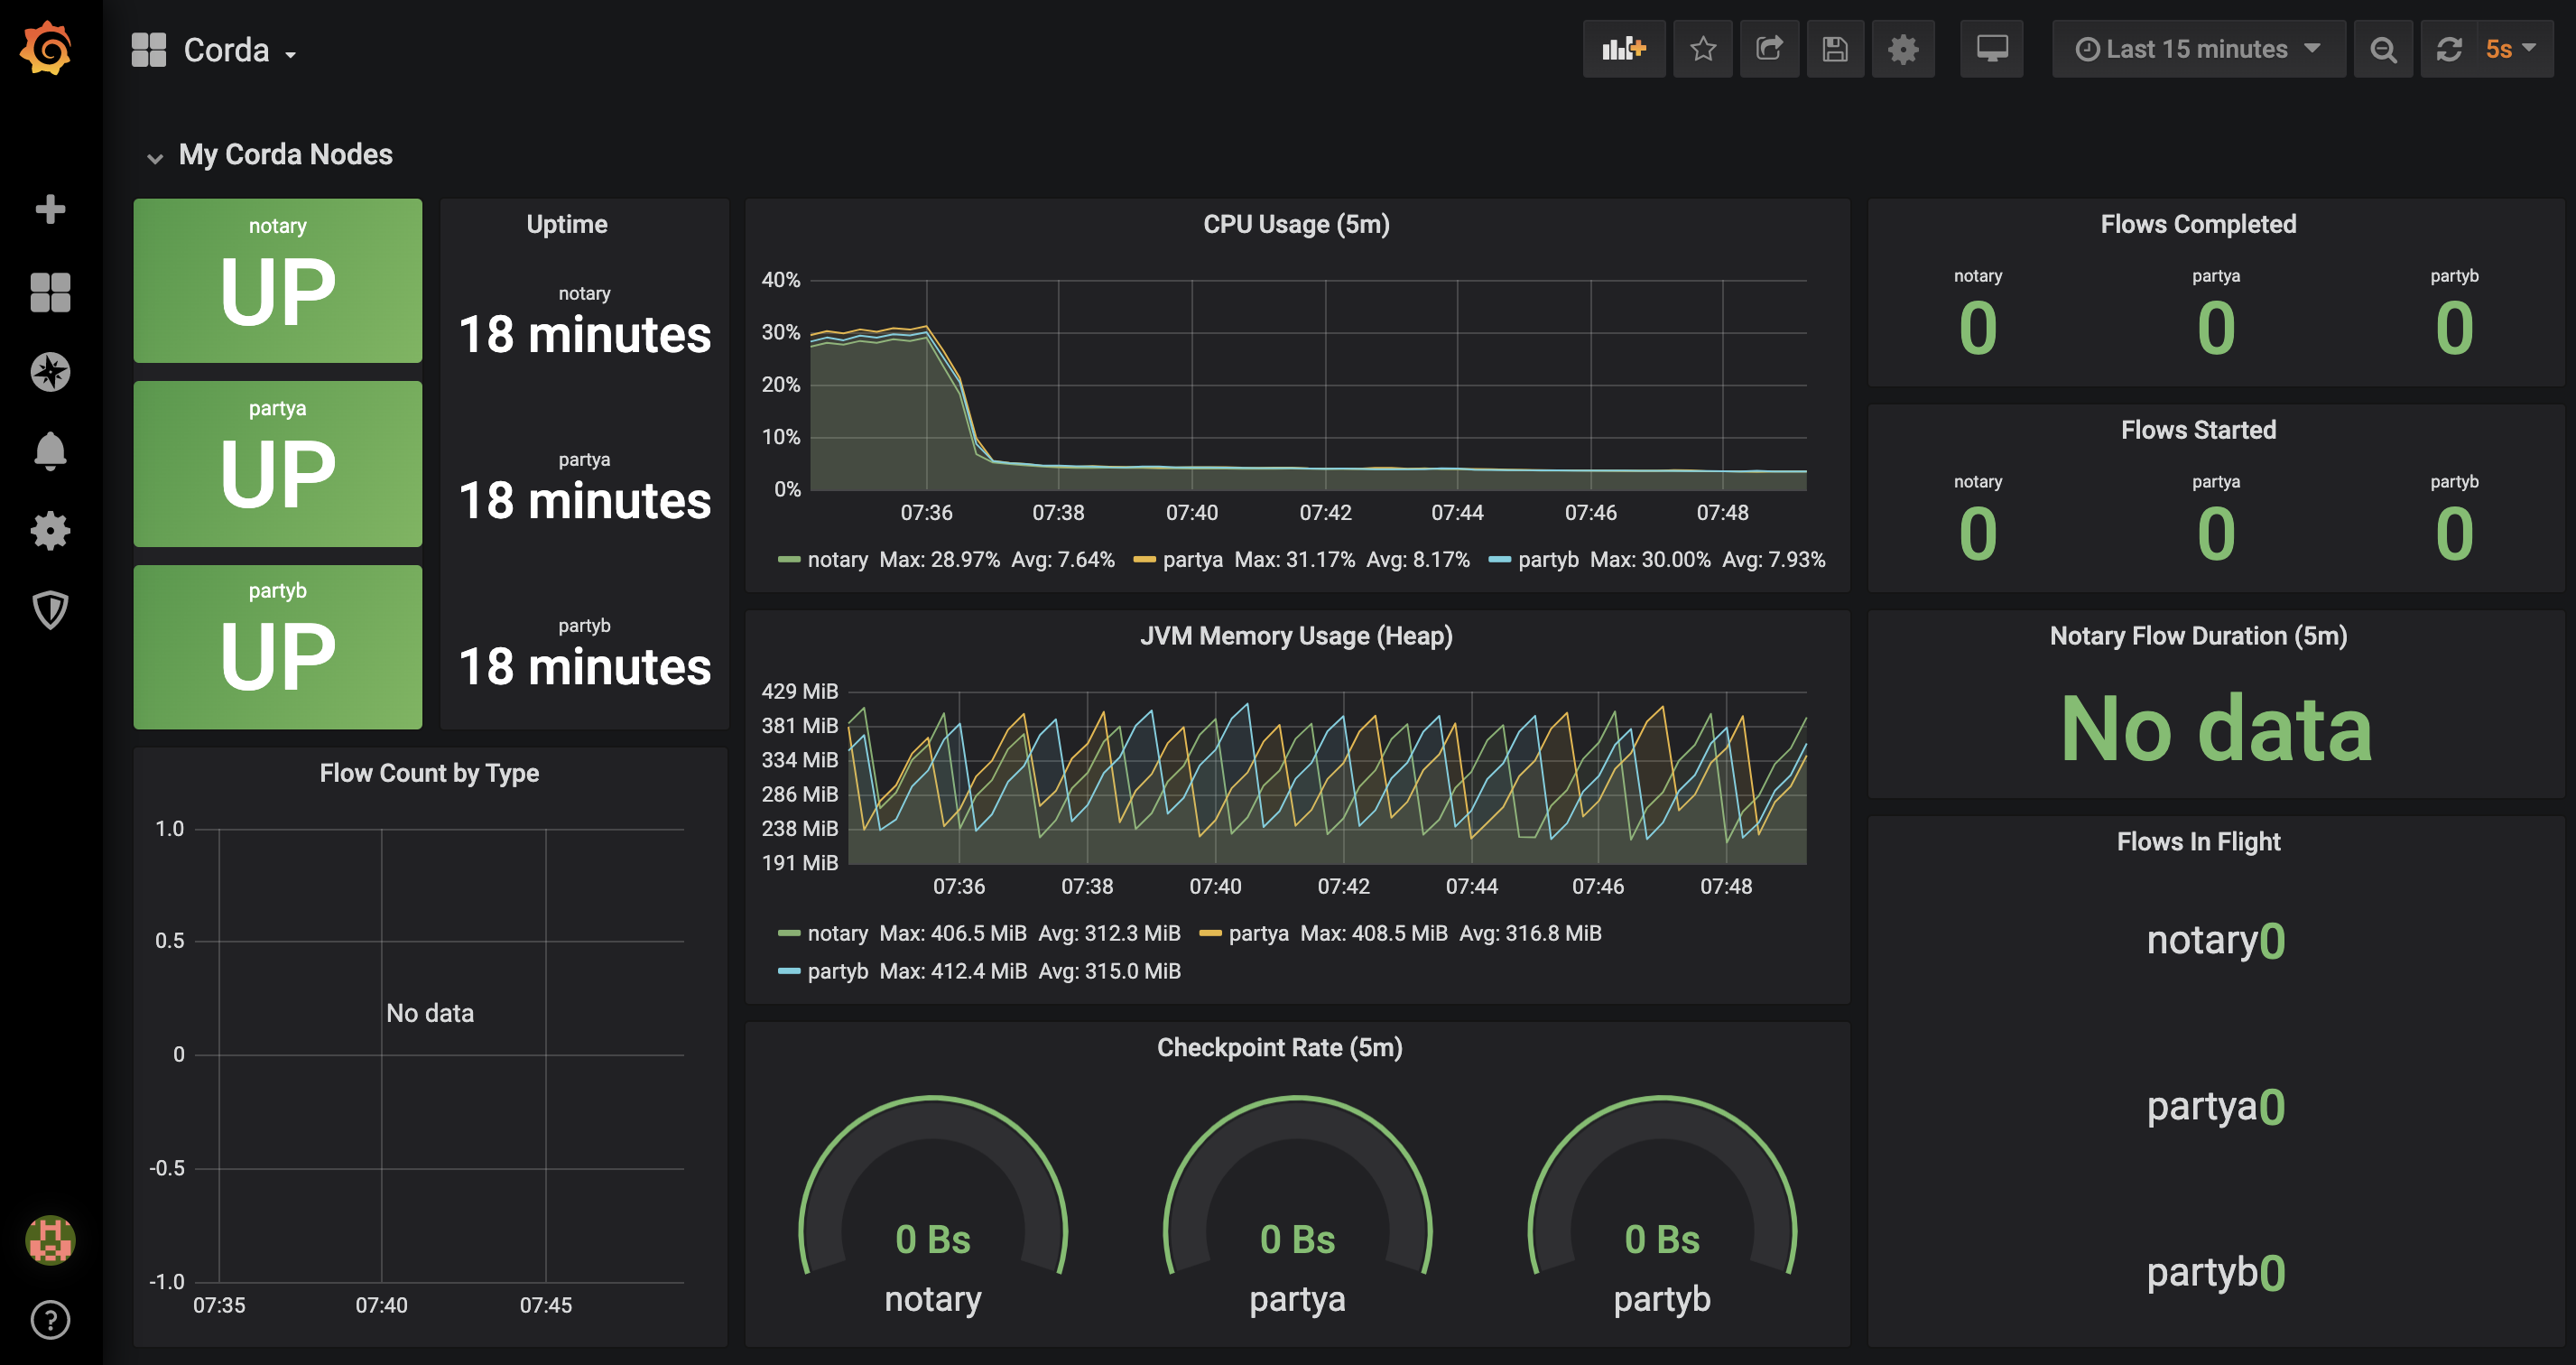
Our Grafana dashboard will look something like this:
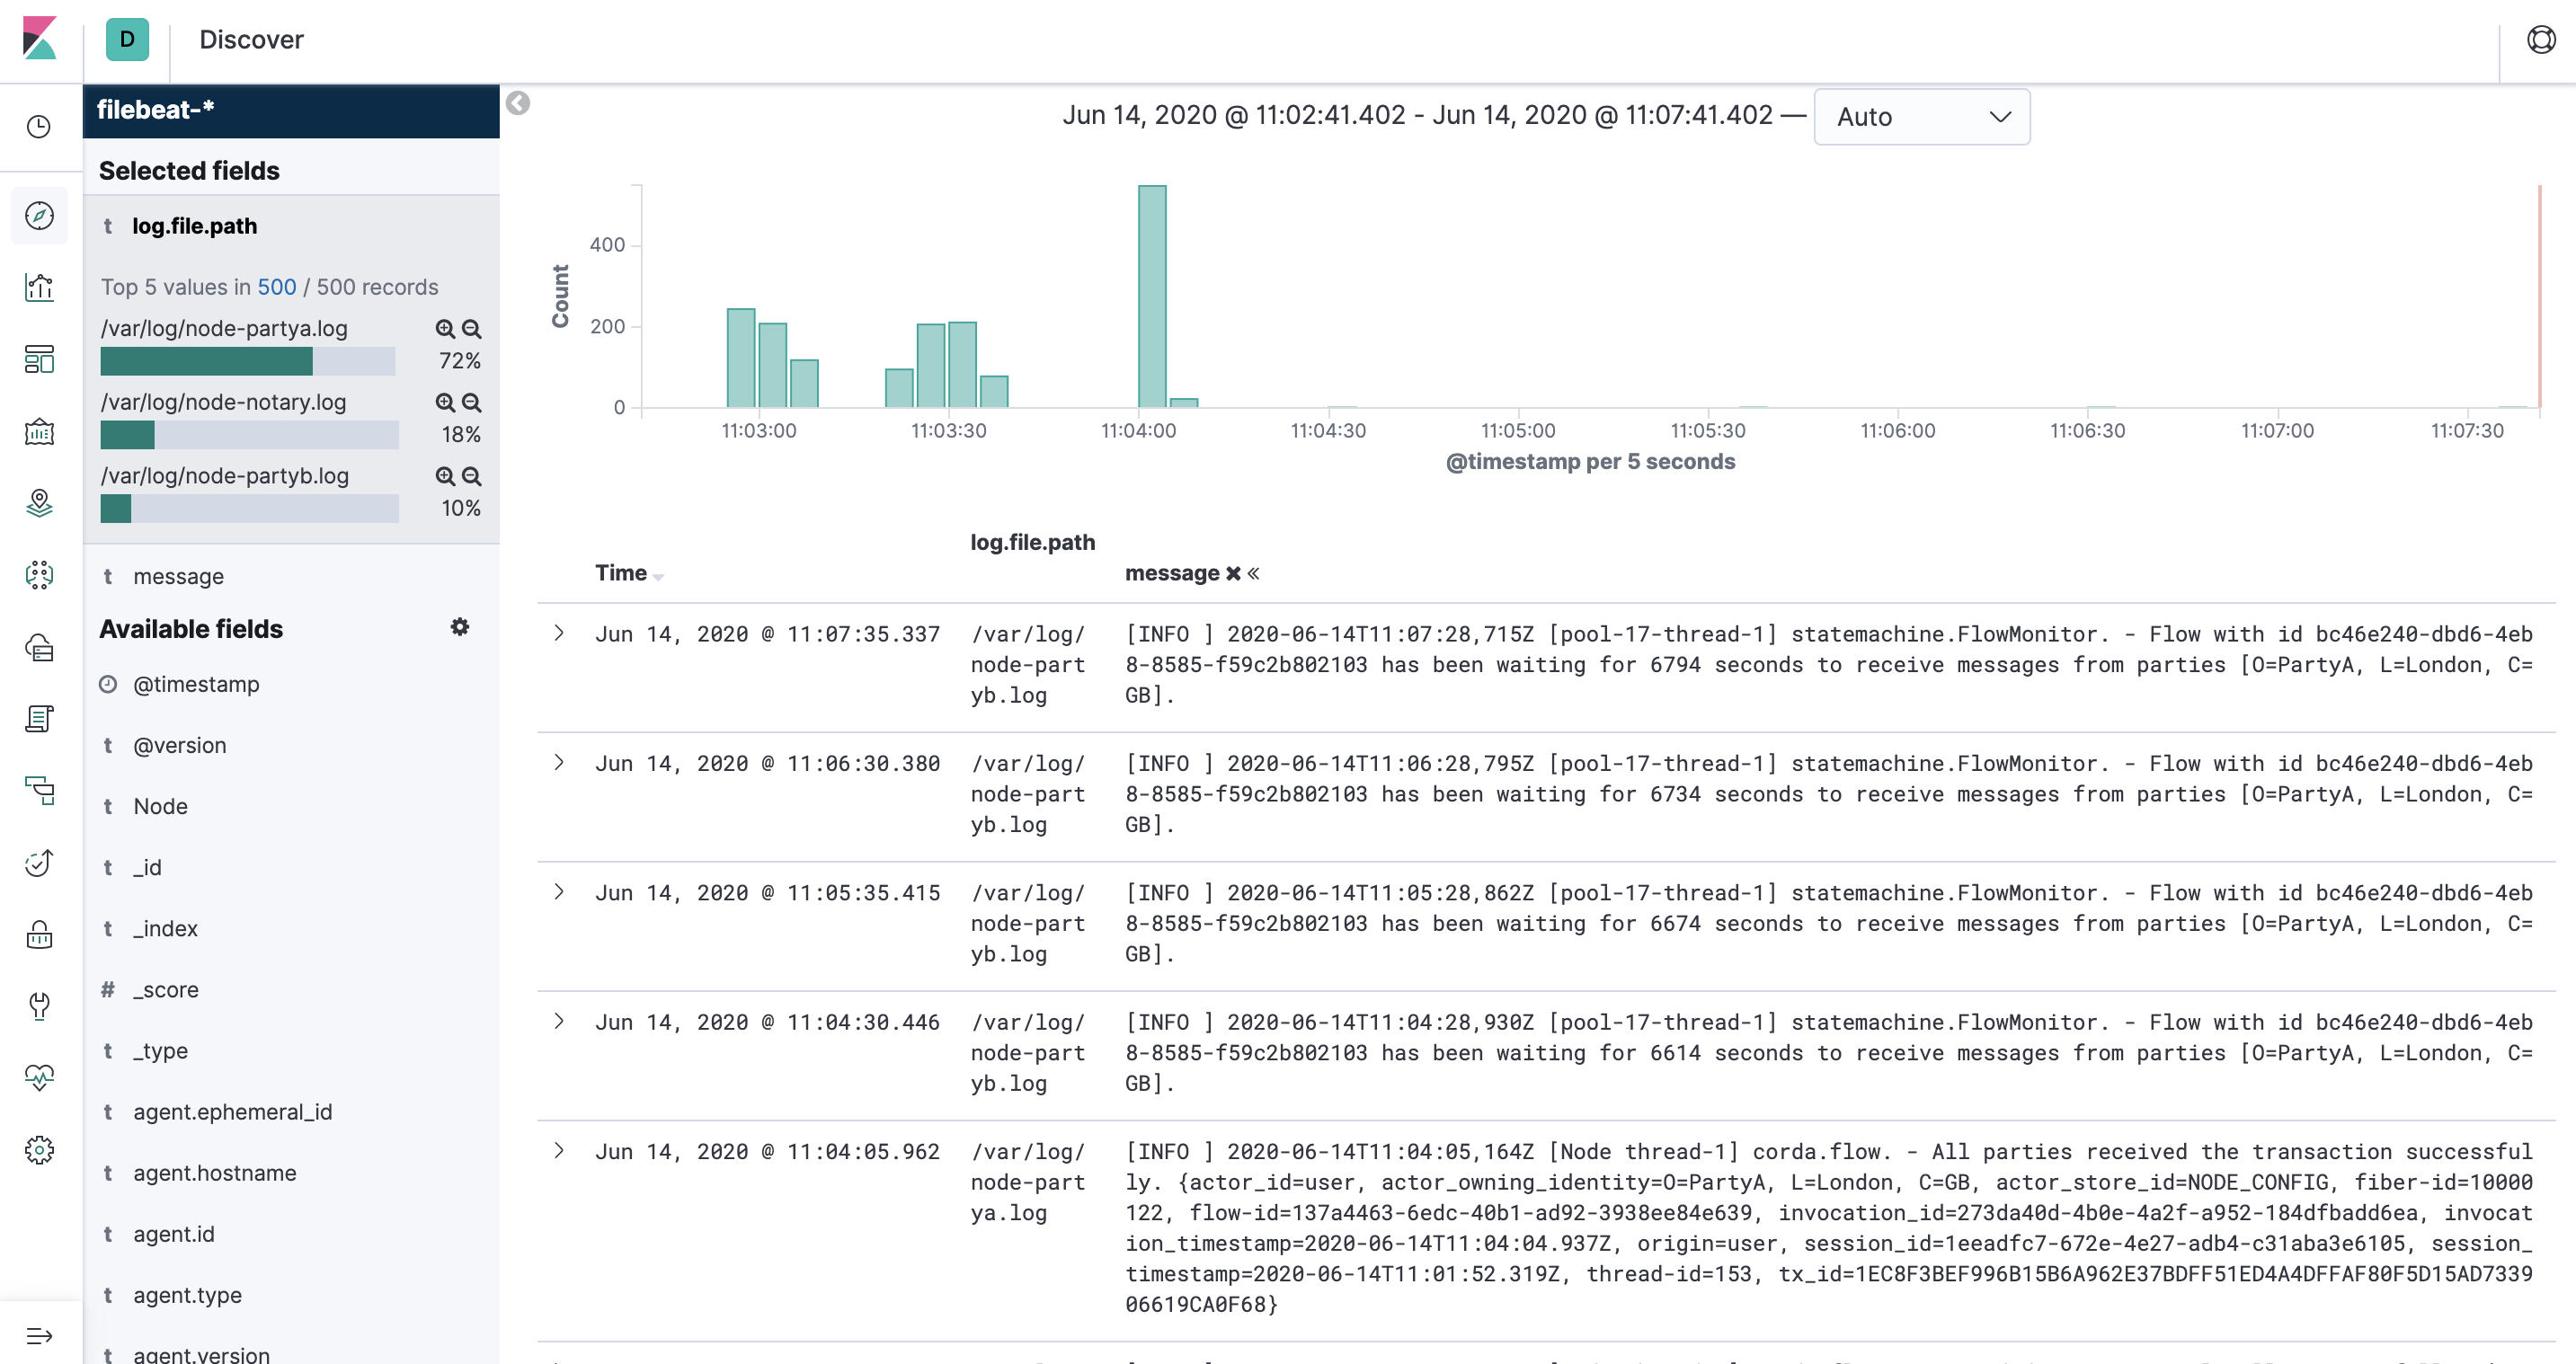
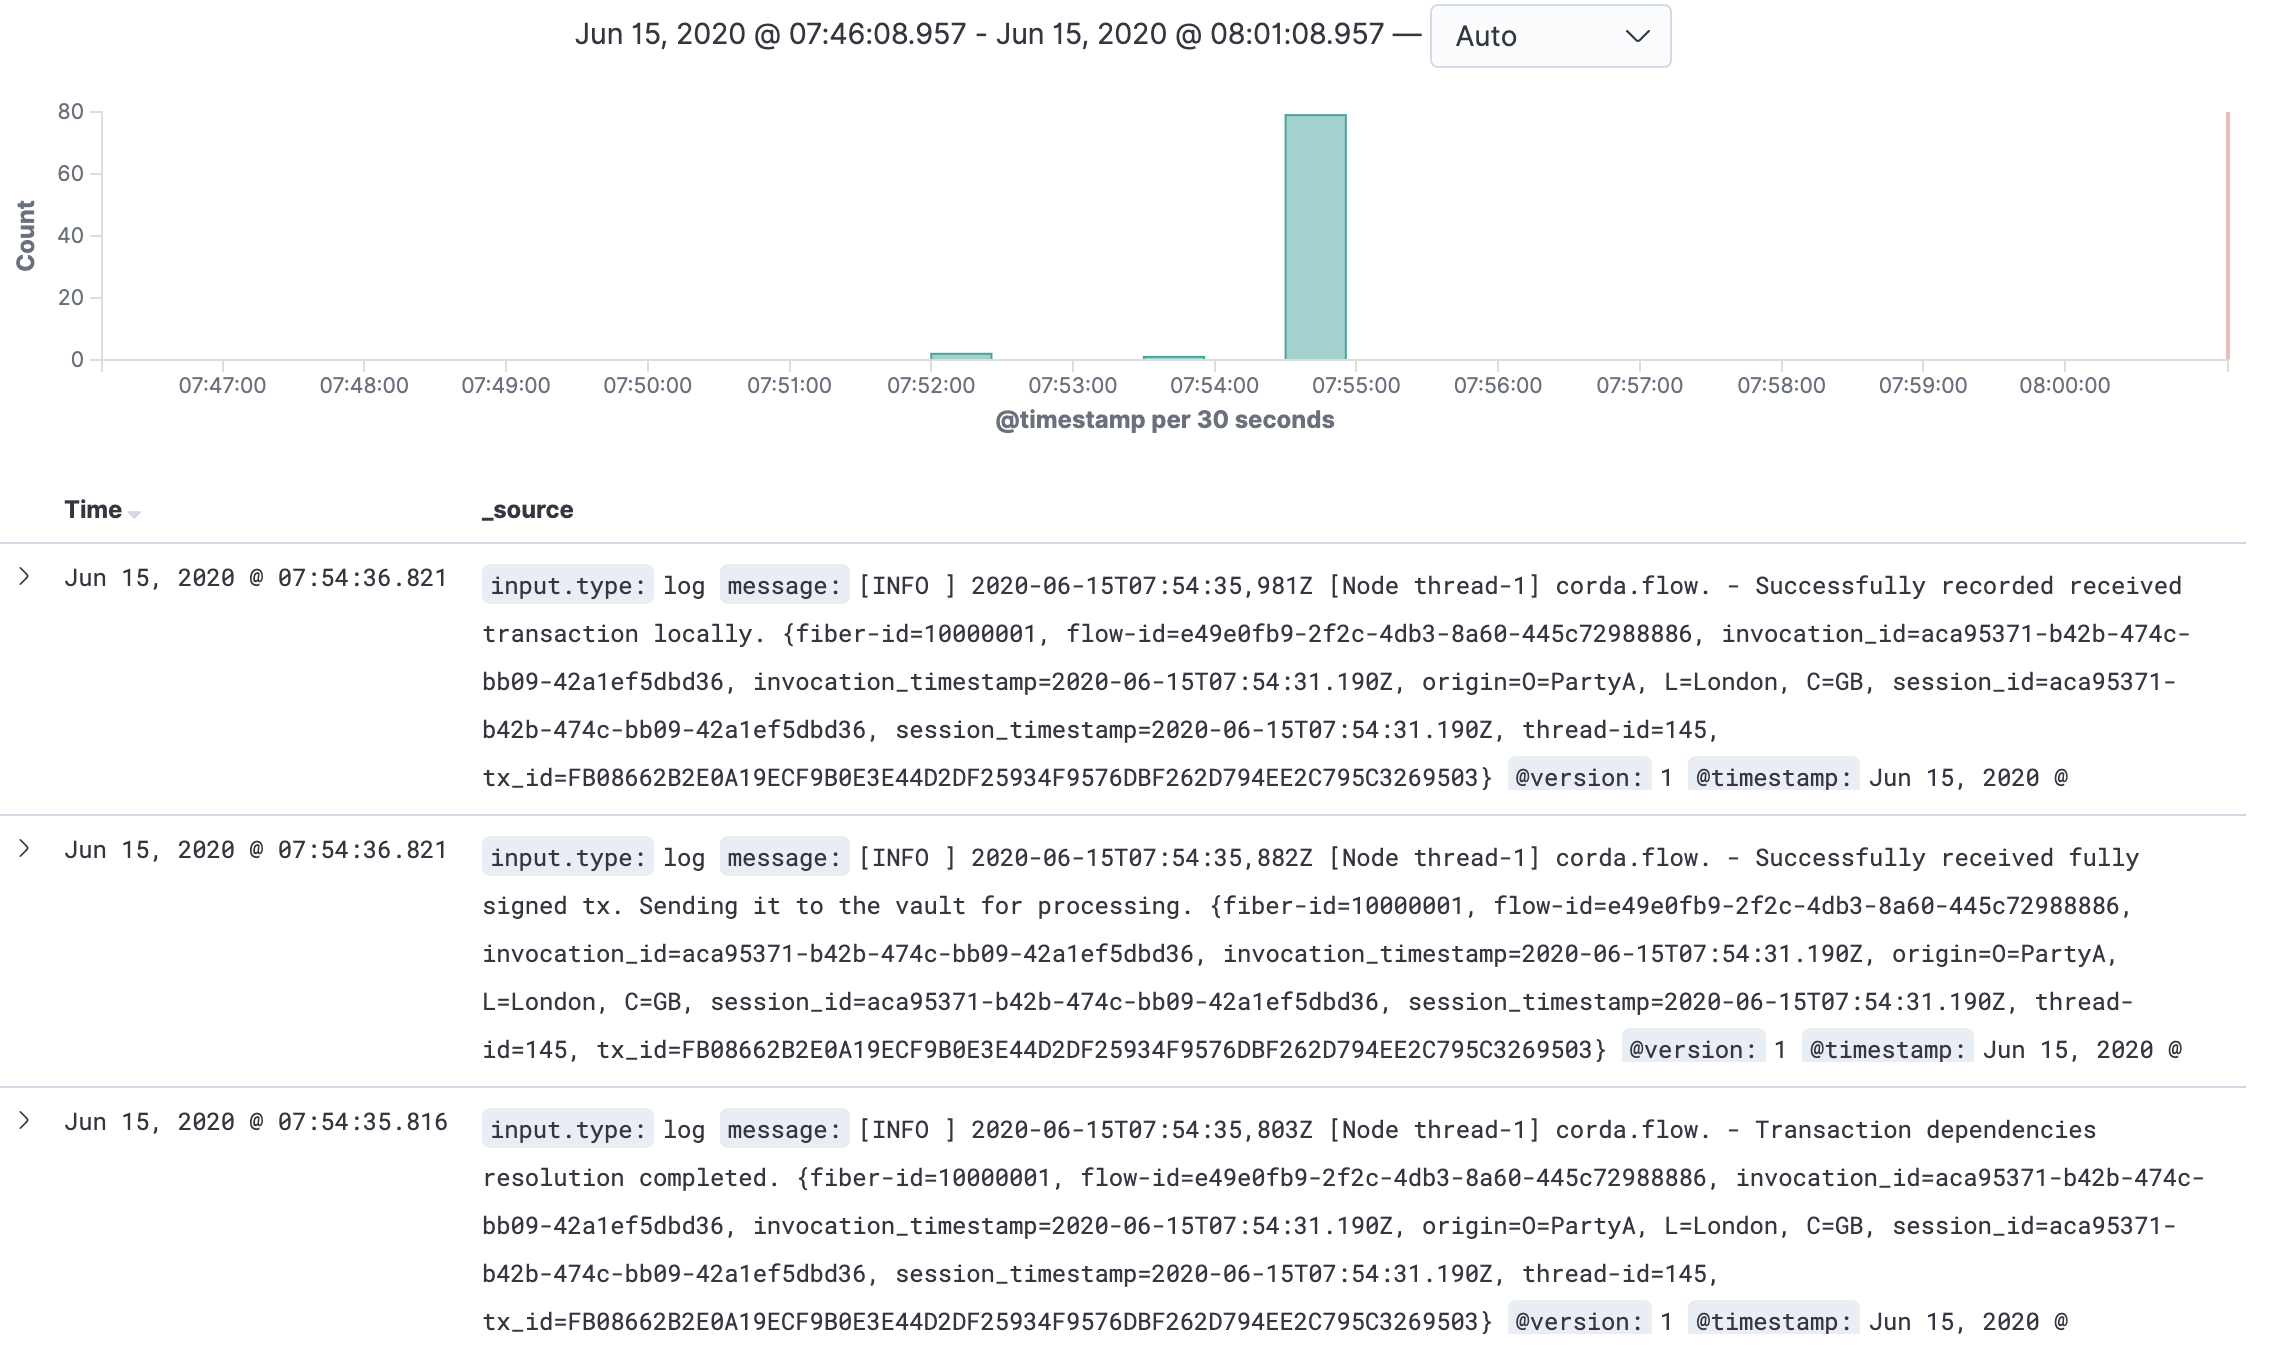
And you can explore node logs from Kibana:
Github
Ready to get started?
Check out the Github Repository where you will find step-by-step instructions in the README and some handy shell scripts.
Clone the repo:
➜ git clone https://github.com/neal-shah/corda-monitoring-prometheus-grafana-elk
Step by step instructions
Step 1: Prepare the workspace directory
Create the directory structure and download the necessary in this step. 3 jars are required:
- corda-tools-network-bootstrapper-4.4.jar
- corda-finance-contracts-4.4.jar
- corda-finance-workflows-4.4.jar
The two corda-finance-*.jar's make up the Corda Finance CorDapp which will be used to test transactions across peer nodes.
Execute the 01_setup-directory.sh shell script:
➜ ./01_setup-directory.sh
You should see a new directory called mynetwork created, with a few sub directories and the required jars.
➜  tree mynetwork
mynetwork
├── corda-finance-contracts-4.4.jar
├── corda-finance-workflows-4.4.jar
├── corda-tools-network-bootstrapper-4.4.jar
├── grafana
├── prometheus
├── filebeat
├── logstash
└── shared
    ├── additional-node-infos
    ├── cordapps
    └── drivers
        └── jmx_prometheus_javaagent-0.13.0.jar
Step 2: Create node configuration files
You will require 3 node configurations:
- Notary
- PartyA
- PartyB
Execute the 02_create-node-configurations.sh shell script:
➜ ./02_create-node-configurations.sh
Our mynetwork directory now looks like the following:
➜  tree mynetwork
mynetwork
├── corda-finance-contracts-4.4.jar
├── corda-finance-workflows-4.4.jar
├── corda-tools-network-bootstrapper-4.4.jar
├── grafana
├── filebeat
├── logstash
├── notary_node.conf
├── partya_node.conf
├── partyb_node.conf
├── prometheus
└── shared
    ├── additional-node-infos
    ├── cordapps
    └── drivers
        └── jmx_prometheus_javaagent-0.13.0.jar
This will create three .conf files, each representing a single node.
Here’s an example of the partya_node.conf file:
devMode=true
emailAddress="test@test.com"
myLegalName="O=PartyA, L=London, C=GB"
p2pAddress="partya:10200"
rpcSettings {
    address="0.0.0.0:10201"
    adminAddress="0.0.0.0:10202"
}
security {
    authService {
        dataSource {
            type=INMEMORY
            users=[
                {
                    password="password"
                    permissions=[
                        ALL
                    ]
                    username=user
                }
            ]
        }
    }
}
cordappSignerKeyFingerprintBlacklist = []
sshd {
  port = 2222
}
Step 3: Run the Corda Network Bootstrapper
The Corda Network Bootstrapper creates a development network of peer nodes, using dev certificates. You don’t need to worry about registering nodes - the bootstrapper takes care of that for you.
Execute the 03_run-corda-network-bootstrapper.sh shell script:
➜ ./03_run-corda-network-bootstrapper.sh

Bootstrapping local test network in /corda-monitoring-prometheus-grafana-elk/mynetwork
Generating node directory for partya
Generating node directory for notary
Generating node directory for partyb
Nodes found in the following sub-directories: [notary, partya, partyb]
Found the following CorDapps: [corda-finance-workflows-4.4.jar, corda-finance-contracts-4.4.jar]
Copying CorDapp JARs into node directories
Waiting for all nodes to generate their node-info files...
Distributing all node-info files to all nodes
Loading existing network parameters... none found
Gathering notary identities
Generating contract implementations whitelist
New NetworkParameters {
      minimumPlatformVersion=6
      notaries=[NotaryInfo(identity=O=Notary, L=London, C=GB, validating=false)]
      maxMessageSize=10485760
      maxTransactionSize=524288000
      whitelistedContractImplementations {

      }
      eventHorizon=PT720H
      packageOwnership {

      }
      modifiedTime=2020-06-09T15:29:59.724Z
      epoch=1
  }
Bootstrapping complete!
Step 4: Prepare for Docker
There are some common files that are shared between the peer nodes. You can put these in one folder - this will make our Docker-Compose service volumes a bit clearer to read.
Execute the 04_copy-common-files.sh shell script:
➜ ./04_copy-common-files.sh
This will copy across common files to the ./mynetwork/shared folder.
Step 5: Create the Prometheus configuration files
Execute the 05_create-monitoring-configurations.sh shell script:
➜ ./05_create-monitoring-configurations.sh
This creates a config file in ./mynetwork/prometheus/prometheus.yml:
global:
  scrape_interval: 5s
  external_labels:
    monitor: "corda-network"
scrape_configs:
  - job_name: "notary"
    static_configs:
      - targets: ["notary:8080"]
    relabel_configs:
      - source_labels: [__address__]
        regex: "([^:]+):\\d+"
        target_label: instance
  - job_name: "nodes"
    static_configs:
      - targets: ["partya:8080", "partyb:8080"]
    relabel_configs:
      - source_labels: [__address__]
        regex: "([^:]+):\\d+"
        target_label: instance
Check out the ./mynetwork/filebeat/ and ./mynetwork/logstash/ directories for their respective configuration files.
You define the JMX exporter targets (endpoints) for each node. They are all using port 8080 - don’t worry about port conflicts, Docker will take care of the networking.
Step 6: Create the Docker-Compose file
Finally, you need a docker-compose.yml file which allows us to bring up all the services in just one command.
Execute the 06_create-docker-compose-file.sh shell script:
➜ ./06_create-docker-compose.sh
You can find the docker-compose.yml file in ./mynetwork/docker-compose.yml. Inside the file, you have created services for Prometheus, Grafana, ELK and Filebeat:
...
  prometheus:
    image: prom/prometheus:latest
    container_name: prometheus
    ports:
      - 9090:9090
    command:
      - --config.file=/etc/prometheus/prometheus.yml
    volumes:
      - ./prometheus/prometheus.yml:/etc/prometheus/prometheus.yml:ro

  grafana:
    hostname: grafana
    container_name: grafana
    image: grafana/grafana:latest
    ports:
      - 3000:3000
    volumes:
      - ./grafana/data:/var/lib/grafana
    environment:
      - "GF_INSTALL_PLUGINS=grafana-clock-panel"

  elk:
      hostname: elk
      container_name: elk
      image: sebp/elk
      volumes:
        - ./logstash/02-beats-input.conf:/etc/logstash/conf.d/02-beats-input.conf
      ports:
        - "5601:5601"
        - "9200:9200"
        - "5044:5044"

  filebeat:
    hostname: filebeat
    container_name: filebeat
    image: docker.elastic.co/beats/filebeat:7.7.1
    volumes:
      - ./filebeat/filebeat.yml:/usr/share/filebeat/filebeat.yml:ro
      - ./partya/logs:/var/log/partya
      - ./partyb/logs:/var/log/partyb
      - ./notary/logs:/var/log/notary
      - /var/lib/docker/containers:/var/lib/docker/containers:ro
    environment:
      - "setup.kibana.host=elk:5601"
      - "output.elasticsearch.hosts=["elk:9200"]"
    depends_on:
      - elk
Start up the services using the following command:
➜ docker-compose -f ./mynetwork/docker-compose.yml up -d

Creating network "mynetwork_default" with the default driver
Creating volume "mynetwork_grafana-storage" with default driver
Creating grafana    ... done
Creating partyb     ... done
Creating prometheus ... done
Creating partya     ... done
Creating elk        ... done
Creating notary     ... done
Creating filebeat   ... done
ELK can take a little while to start up, you can track its progress by following the container logs:
docker logs -f elk.
ELK will be fully started when you see the following output:
➜ docker logs -f elk
...
[2020-06-14T20:12:53,575][INFO ][logstash.inputs.beats    ] Beats inputs: ?Starting input listener {:address=>"0.0.0.0:5044"}
[2020-06-14T20:12:53,595][INFO ][logstash.javapipeline    ] Pipeline started {"pipeline.id"=>"main"}
[2020-06-14T20:12:53,765][INFO ][logstash.agent           ] Pipelines running {:count=>1, :running_pipelines=>[:main], :non_running_pipelines=>[]}
[2020-06-14T20:12:53,772][INFO ][org.logstash.beats.Server] Starting server on port: 5044
[2020-06-14T20:12:54,398][INFO ][logstash.agent           ] Successfully started Logstash API endpoint {:port=>9600}
View running containers:
➜ docker ps -a
CONTAINER ID        IMAGE                                    COMMAND                  CREATED             STATUS              PORTS                                                                              NAMES
a35d3042490d        docker.elastic.co/beats/filebeat:7.7.1   "/usr/local/bin/dock…"   4 minutes ago       Up 4 minutes                                                                                           filebeat
16e142719907        sebp/elk                                 "/usr/local/bin/star…"   4 minutes ago       Up 4 minutes        0.0.0.0:5044->5044/tcp, 0.0.0.0:5601->5601/tcp, 0.0.0.0:9200->9200/tcp, 9300/tcp   elk
f2310f6d336f        corda/corda-zulu-java1.8-4.4:latest      "run-corda"              4 minutes ago       Up 4 minutes        10200/tcp, 0.0.0.0:2222->2222/tcp, 10202/tcp, 0.0.0.0:10005->10201/tcp             partya
e04278061856        corda/corda-zulu-java1.8-4.4:latest      "run-corda"              4 minutes ago       Up 4 minutes        10200/tcp, 10202/tcp, 0.0.0.0:10002->10201/tcp                                     notary
61aeb9a442a9        corda/corda-zulu-java1.8-4.4:latest      "run-corda"              4 minutes ago       Up 4 minutes        10200/tcp, 10202/tcp, 0.0.0.0:3333->2222/tcp, 0.0.0.0:10008->10201/tcp             partyb
712b28c69970        prom/prometheus:latest                   "/bin/prometheus --c…"   4 minutes ago       Up 4 minutes        0.0.0.0:9090->9090/tcp                                                             prometheus
97a5c3bc19ce        grafana/grafana:latest                   "/run.sh"                4 minutes ago       Up 4 minutes        0.0.0.0:3000->3000/tcp                                                             grafana
Step 7: Set up Kibana
Head over to your browser, and go to http://localhost:5601. You should see the Kibana homepage.
On the left pane, click on the cog icon.
Under Kibana, click Index Patterns.
Click Create Index Pattern.
In the Index pattern field, enter filebeat-*.
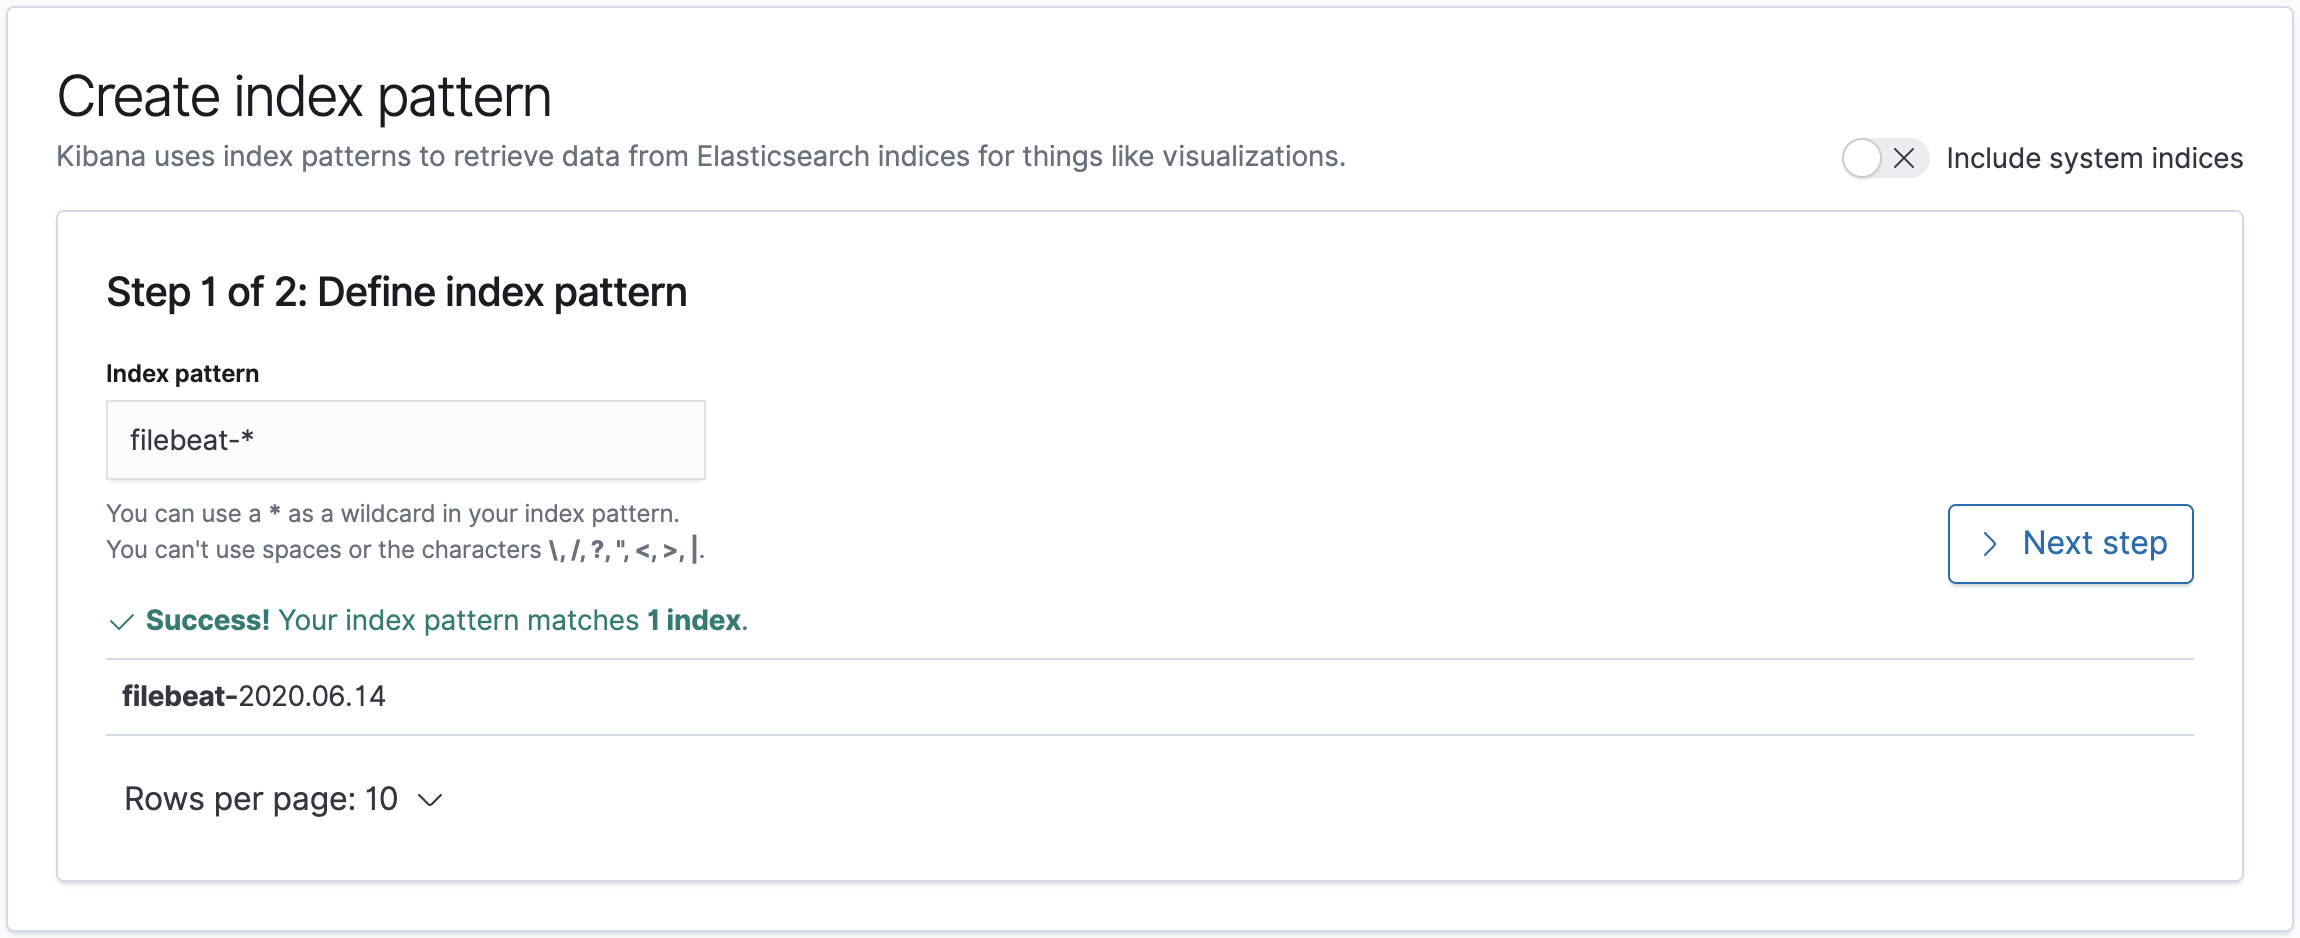
Click Next step.
Under the Time Filter field name dropdown, select @timestamp.
Click Create Index Pattern.
Voila, your index pattern has been created!
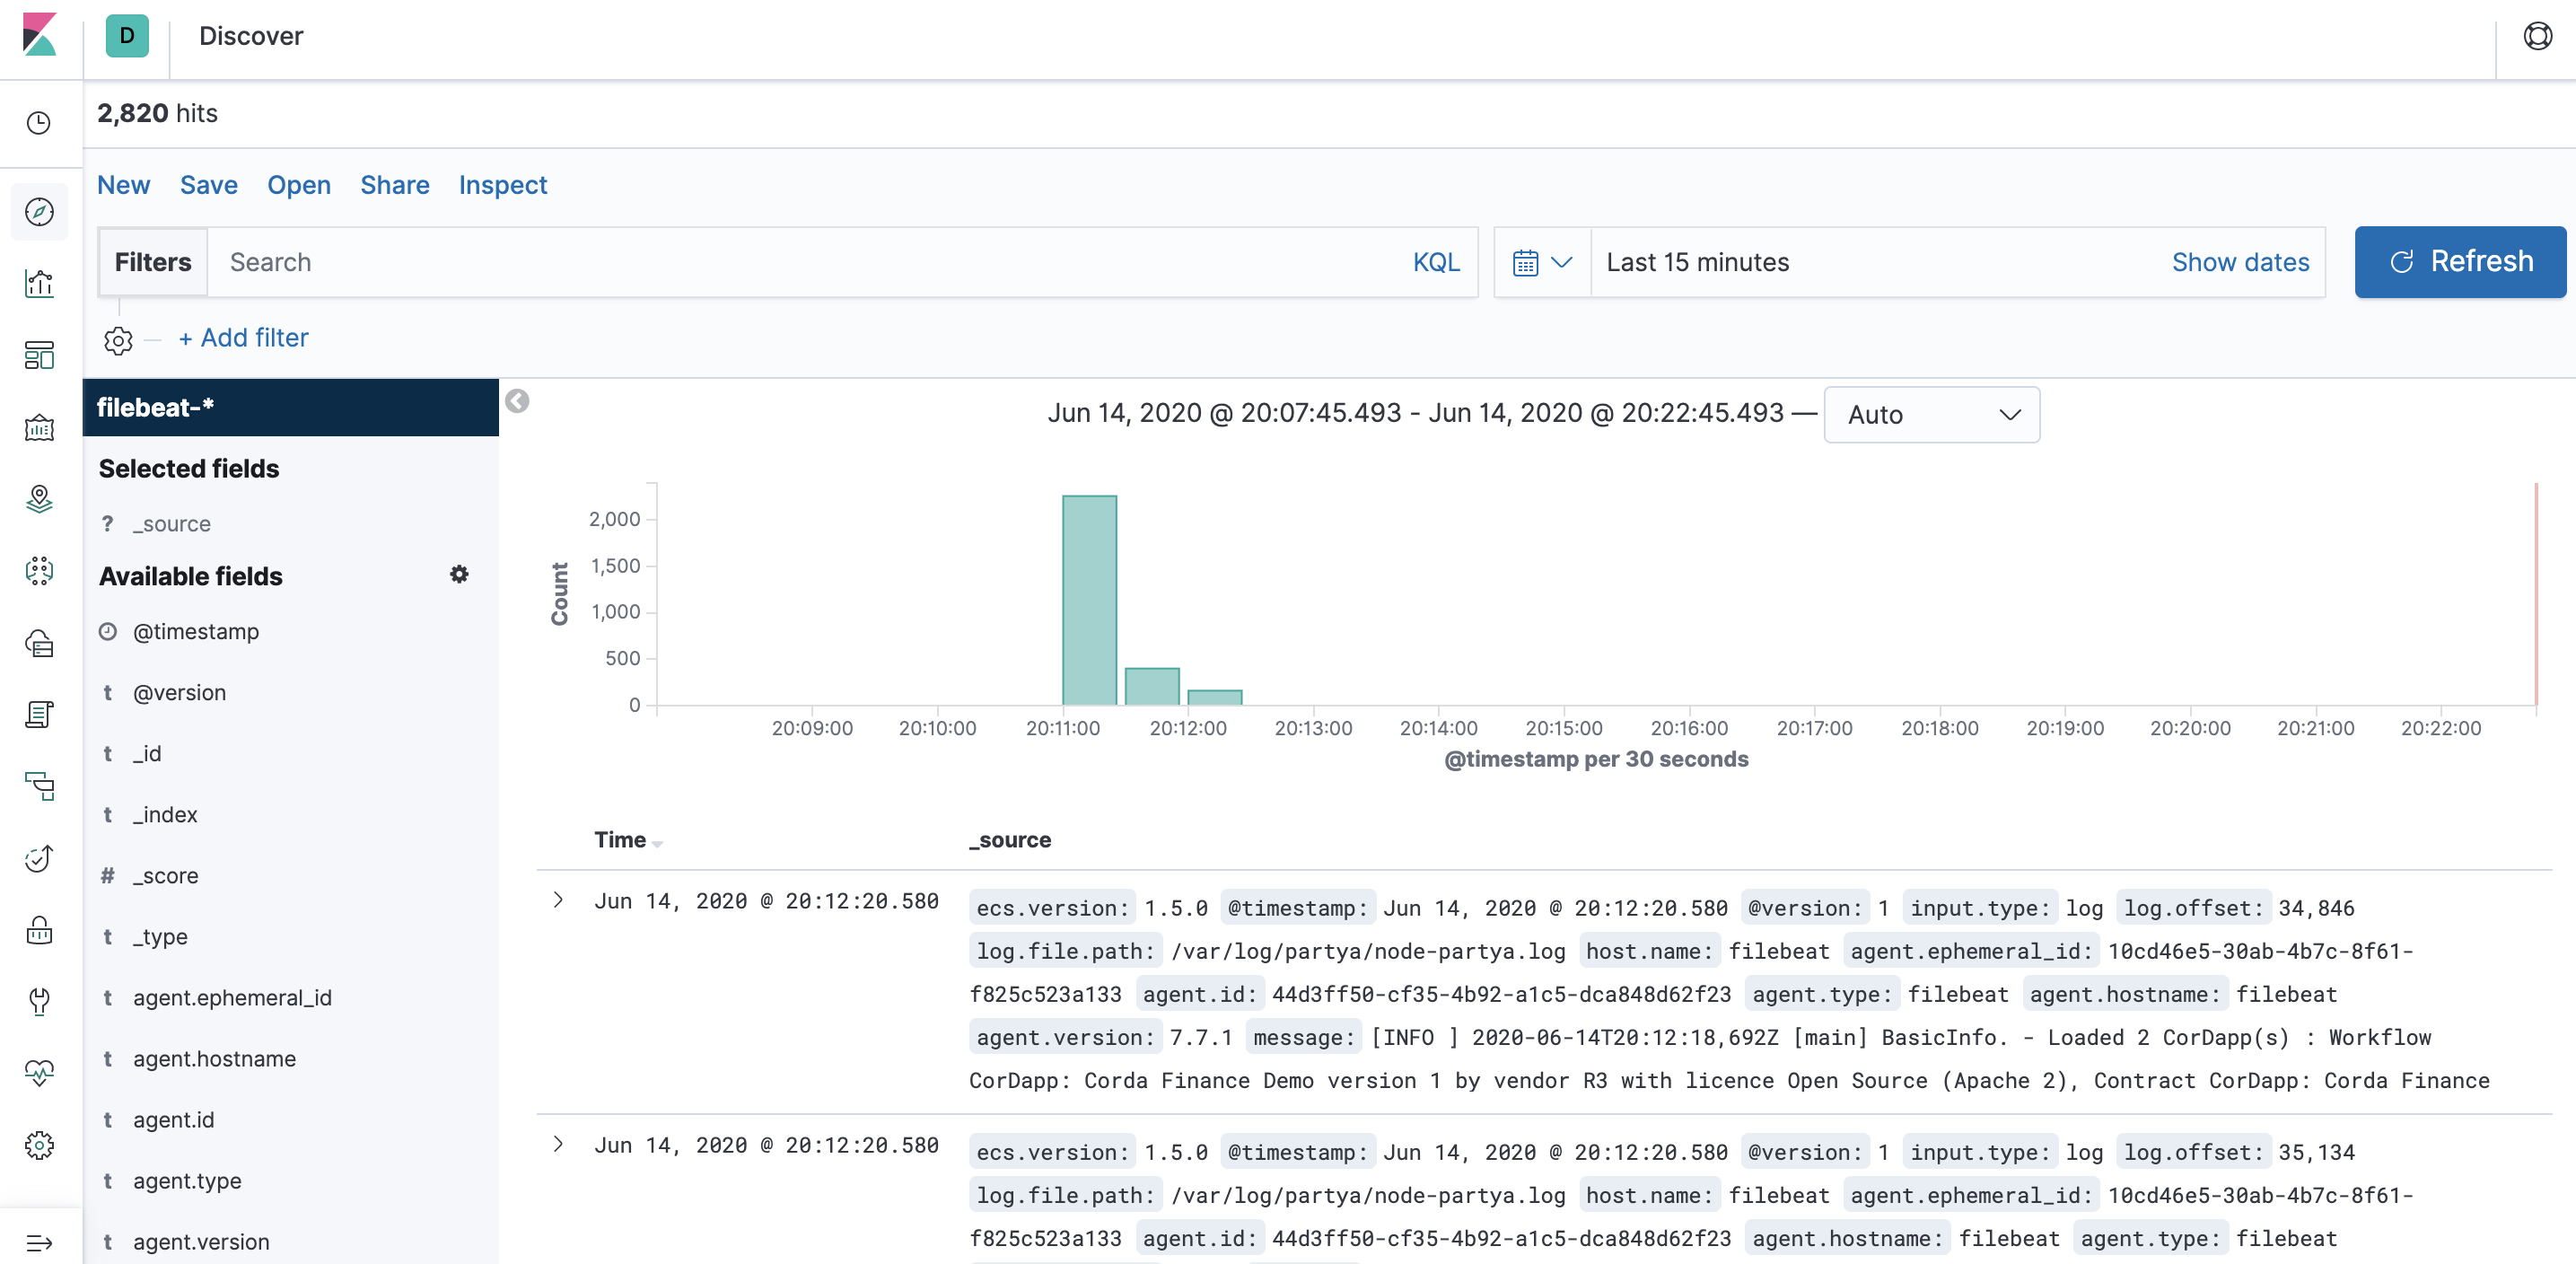
Click on the Discover icon on the left pane, you should see some logs:
Step 8: Set up Grafana
On your browser, go to http://localhost:3000.
Grafana will ask you for a login - the default admin login is:
- Username: admin
- Password: admin
Change your password as instructed, and then you should see the Grafana homepage.

Click on Add data source.
Select the Prometheus data source under Time series databases.
Under HTTP, set the URL to http://prometheus:9090. You can use the Prometheus Docker container hostname here as all of the containers run on the same Docker bridge network, so no explicit container IP addresses need to be used for connectivity.
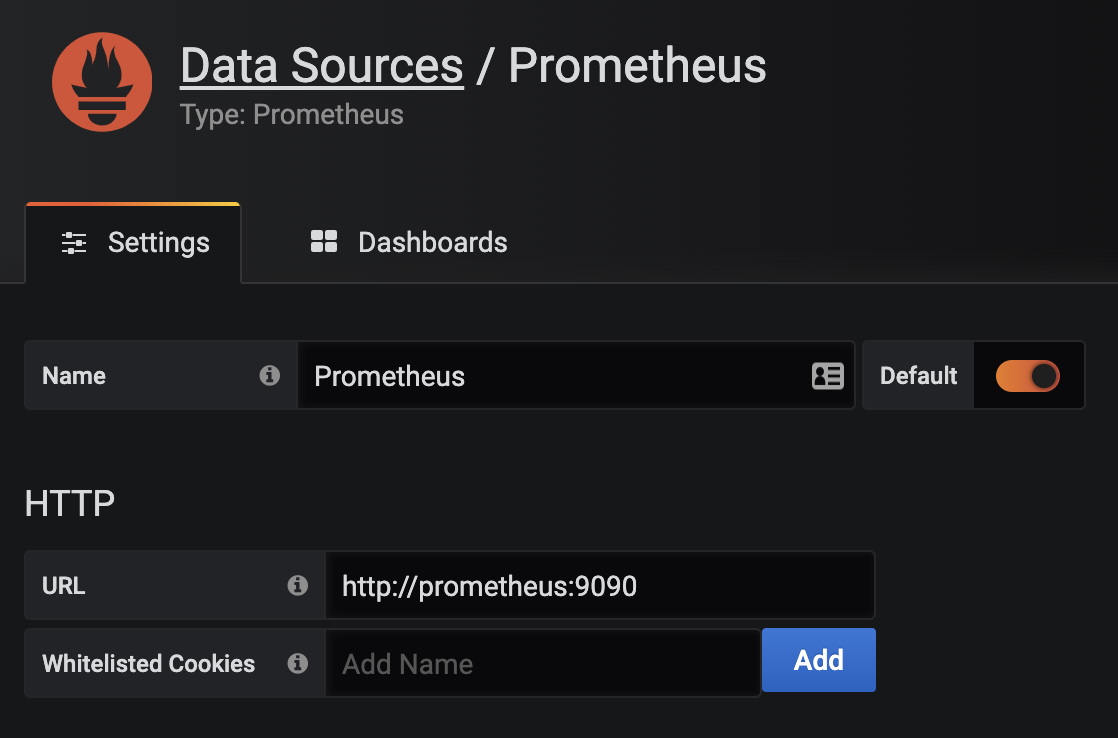
At the bottom of the page, click on Save & Test. You should see a green alert - Data source is working.
Hover over the Dashboards icon, and click Manage.
Click Import, then Upload .json file, and navigate to the clone repository folder. Inside the grafana folder, you will see a json file - Grafana-Corda-Dashboard.json, see here.
On the following screen, click Import.
Boom, a dashboard appears!
Step 9: Run some Corda Finance flows
SSH into the PartyA node Crash shell:
➜ ssh user@localhost -p 2222
When prompted, the password is password.
You should see the following in your terminal:
Welcome to the Corda interactive shell.
You can see the available commands by typing 'help'.

Mon Jun 15 07:52:13 GMT 2020>>>
Let’s execute a CashIssueAndPaymentFlow:
Mon Jun 15 07:53:52 GMT 2020>>> flow start CashIssueAndPaymentFlow amount: 1000 GBP, issueRef: TestTransaction, recipient: PartyB, anonymous: false, notary: Notary

 ✓ Starting
 ✓ Issuing cash
          Generating anonymous identities
     ✓ Generating transaction
     ✓ Signing transaction
     ✓ Finalising transaction
              Requesting signature by notary service
                  Requesting signature by Notary service
                  Validating response from Notary service
         ✓ Broadcasting transaction to participants
 ✓ Paying recipient
     ✓ Generating anonymous identities
     ✓ Generating transaction
     ✓ Signing transaction
     ✓ Finalising transaction
         ✓ Requesting signature by notary service
             ✓ Requesting signature by Notary service
             ✓ Validating response from Notary service
         ✓ Broadcasting transaction to participants
▶︎ Done
Flow completed with result: Result(stx=SignedTransaction(id=FB08662B2E0A19ECF9B0E3E44D2DF25934F9576DBF262D794EE2C795C3269503), recipient=O=PartyB, L=London, C=GB)
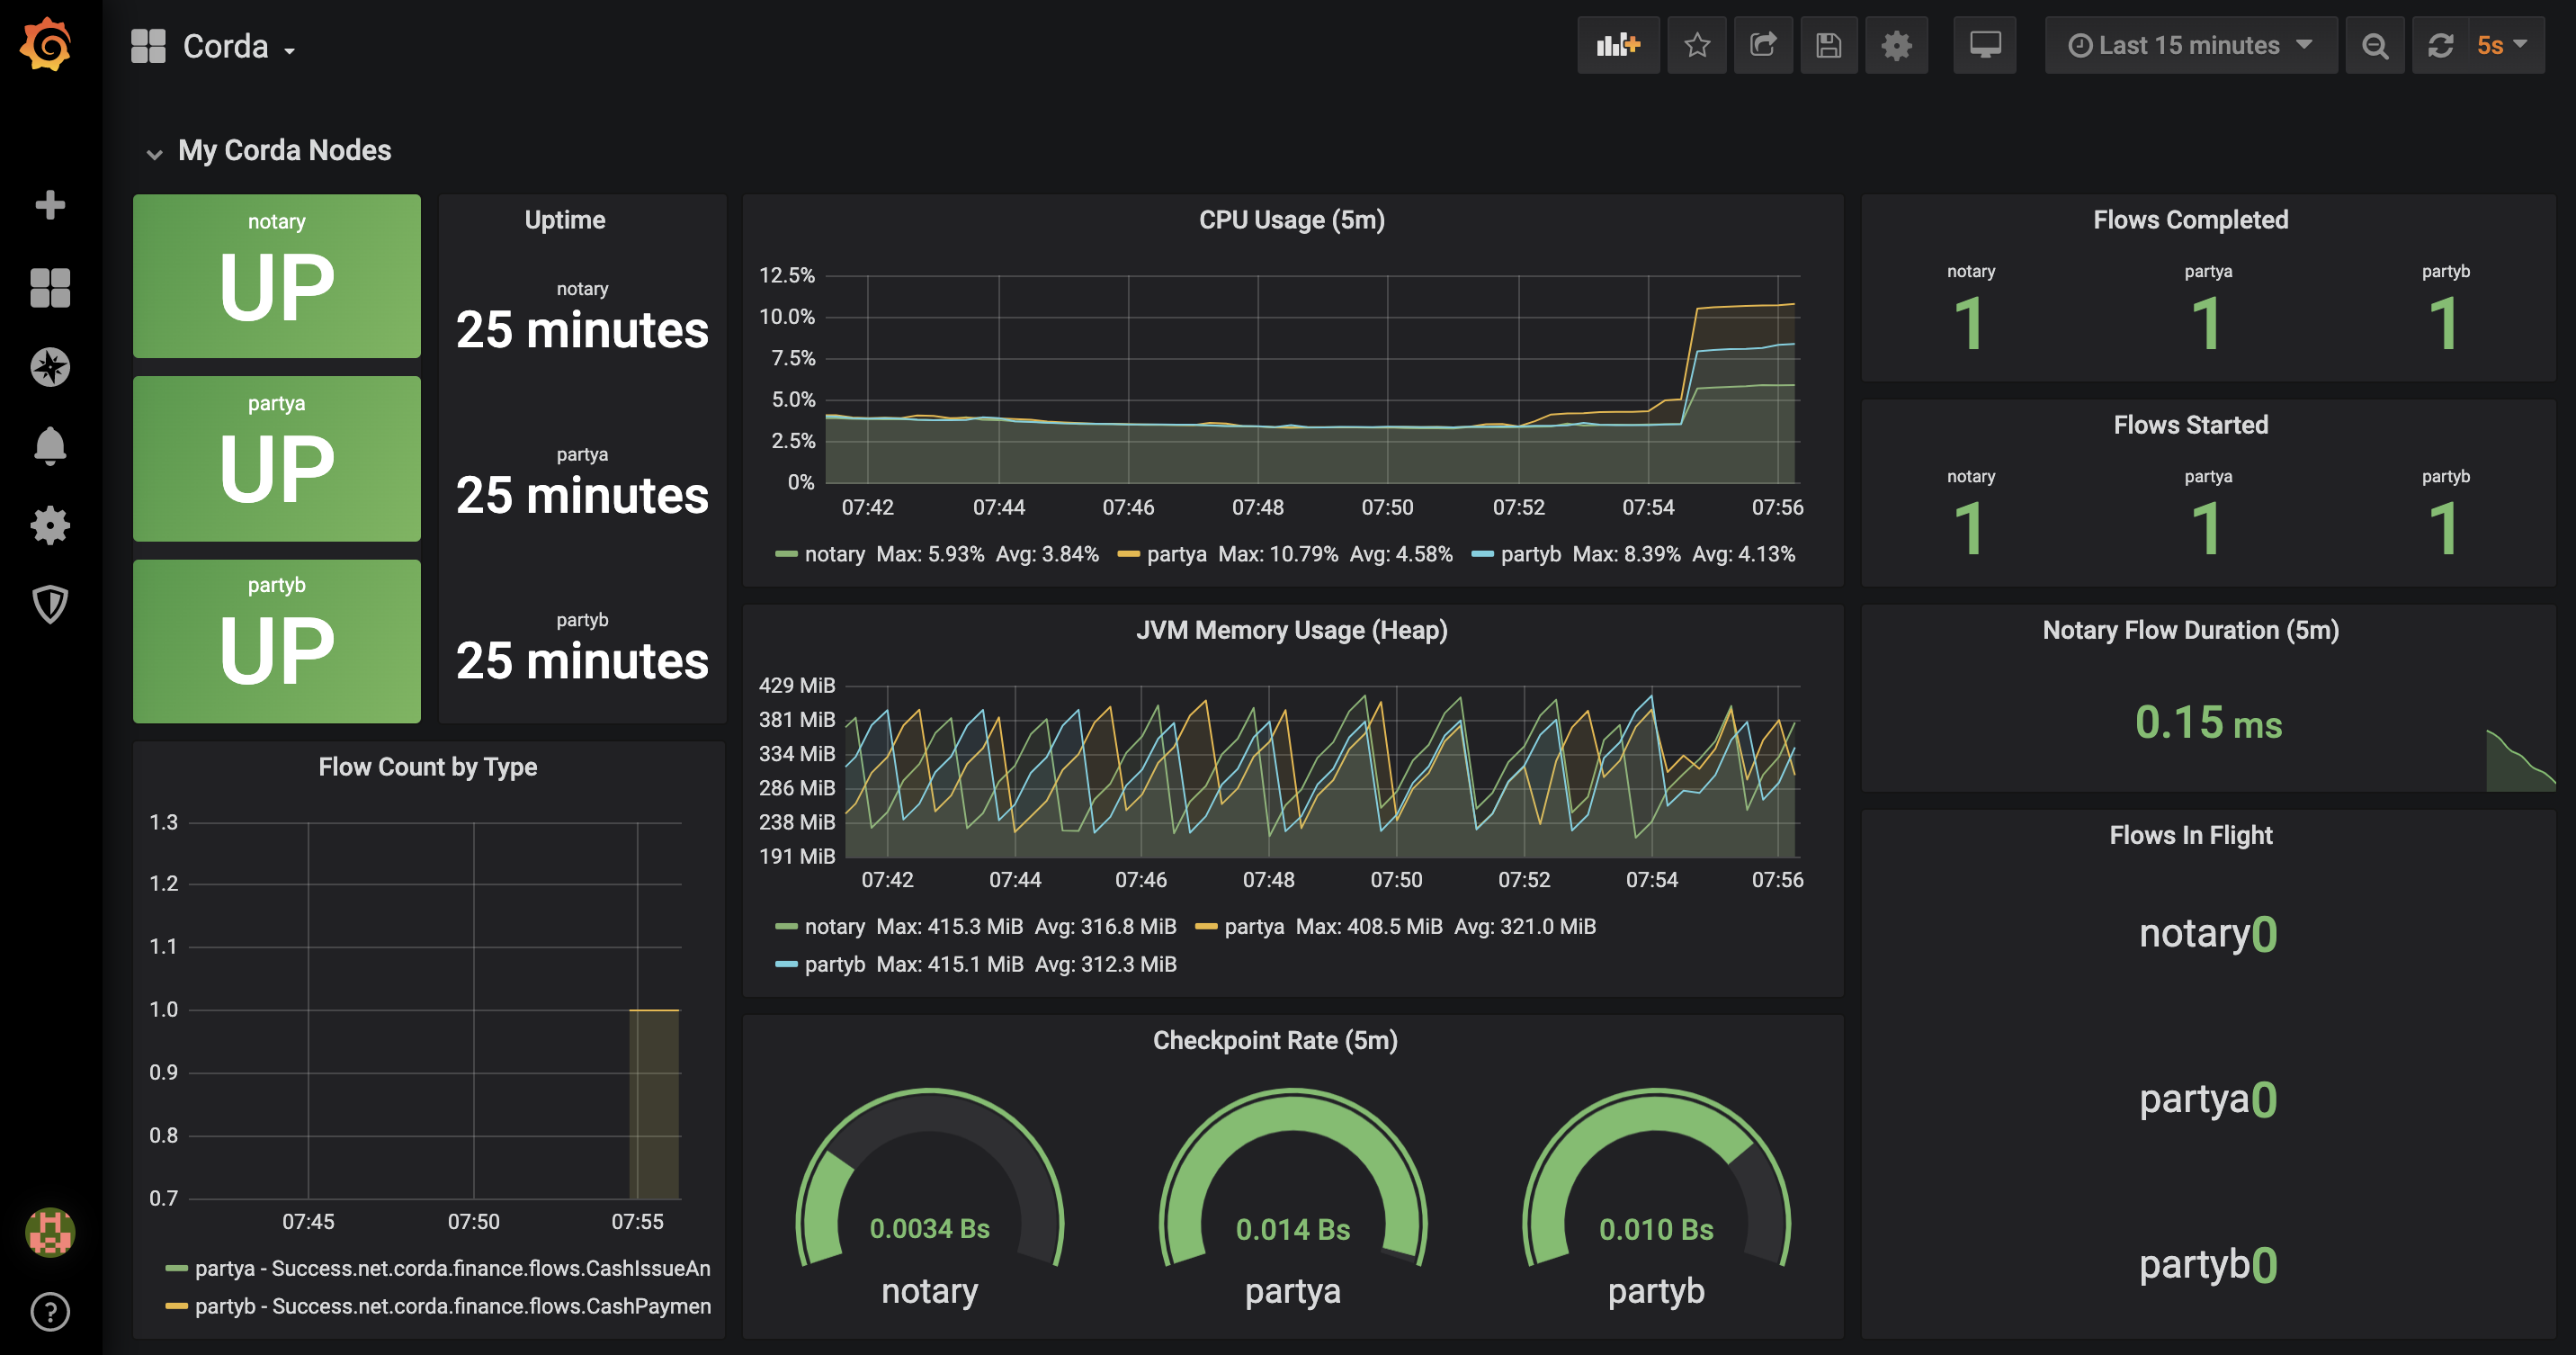
Step 10: Explore Grafana and ELK
Go back to your Grafana dashboard. You will see the following:
In another browser window/tab, go to the Kibana dashboard and click on the Discover icon.
You should see the following:
Further reading
JMX Monitoring and Prometheus
Corda nodes expose JMX metrics that can be collected to provide data analysis and monitoring functionality.
This is enabled using 2 components:
- On the node side, the Prometheus JMX Exporter is run as a JVM plugin and provides an API interface for the JMX metrics.
- The Prometheus Server collects these metrics using a pre-defined scrape interval, providing both a UI and an API for processed data to be consumed.
To run Corda with the Prometheus JMX Exporter, add the driver to the drivers folder in the node directory, and run the corda.jar with the -javagent option. For example:
➜ java -Dcapsule.jvm.args=-javaagent:/path/to/jmx_prometheus_javaagent-0.13.0.jar=8080:/path/to/config.yml -jar corda.jar
The Prometheus JMX Exporter config.yml as specified above can contain config options as specified here - you can simply make this file contain {} to use default options.
The Prometheus Server also requires a configuration file, prometheus.yml, containing a number of config options such as setting target exporters, alerting and rules.
Here is a simple example of a prometheus.yml file targeting a single Corda node which is exporting JMX metrics:
global:
  scrape_interval: 10s        # How frequently to scrape targets
  external_labels:            # Label that can be used by external systems for filtering
    monitor: "corda-network"
scrape_configs:               # A list of scrape configurations
  - job_name: "nodes"         # The job name assigned to scraped metrics
    static_configs:           # Static list of targets to scrape metrics from
      - targets: ["partya:8080", "partyb:8080"]
    relabel_configs:          # List of target relabel configurations
      - source_labels: [__address__]
        regex: "([^:]+):\\d+"
        target_label: instance
Under the global block, you can set global attributes to all the scrape_configs. Here, you set the scrape_interval to get metrics every 10 seconds. scrape_configs tells Prometheus what services to target and scrape metrics from.
relabel_configs block in the config above allows you to rewrite the target labels - for example, partya:8080 as the instance label will become partya. This just makes things a bit neater when displaying information on a dashboard.
Grafana
Grafana provides a slick UI interface for consuming and aggregating realtime data from our exposed JMX metrics. You can indeed use Graphite rather than Prometheus - there are a number of Graphite vs. Prometheus articles online to determine your choice.

ELK (Elasticsearch, Logstash, Kibana) & Filebeat
The ELK stack is a great way to source, process and display log files. Elasticsearch and Logstash work in harmony to process data from multiple sources (in our case, the node log files), whilst Kibana is able to visualise the normalised data, producing highly responsive searchable data from multiple root sources.
Filebeat is the log shipper, fowarding logs to Logstash. In your deployment, you only ship our node log files (Notary, PartyA and PartyB) - Filebeat requires a config file to know which files to forward into Logstash.
filebeat.config:
  modules:
    path: ${path.config}/modules.d/*.yml
    reload.enabled: false

filebeat.inputs:
- type: log
  enabled: true
  paths:
    - "/var/log/node-*"

output.logstash:
    hosts: ["logstash:5044"]
filebeat.inputs are the input log files, outputs are forwarded to the Logstash host:port.
Conclusion
Deploying monitoring and performance services for Corda nodes can be successfully carried out with the use of Prometheus, Grafana and ELK.
Prometheus requires very little configuration to get up and running and provides a powerful tool to aggregate time series metrics. Prometheus Query Language (PromQL) provides query functions that are extremely powerful and versatile, allowing you to transform data when required and build complex equations for your use case. If you’d like to learn more about PromQL, check out Aliaksandr Valialkin’s blog post.
The latest version of Grafana v7.0 has produced further stability and some new features - generally, the user experience is far smoother and desirable. Prometheus PromQL support is fully available once the data source is connected, so minimal configuration is required to get up and running.
In the example in this blog post, the ELK stack is deployed to pull the node log files into one location - so no more having to tail log files at multiple locations. Kibana allows you to filter the source logs file, and display the data is an easy-to-read way. ELK is far more powerful than this - you can carry out advanced operations such as scraping log file for particular pieces of information, generating time series based visualisations and alerting. Possibly an idea for a future blog post.
In conclusion, I hope that this post gives you the basic deployment setup for a full monitoring stack. Of course, for production environments you should ensure that the services are deployed in a way that is production ready - using SSL connectivity etc. You can read up on these deployment methods in the respective Prometheus, Grafana or ELK documentation.
monitoringprometheusdockergrafanacordaelkelasticsearchlogstashkibana
2351 Words
2020-06-13 11:16 +0000
c5d5c3e @ 2020-06-25